
Why do you need analytics

You don't understand where the money for logistics is going
Logistics data analytics breaks down the cost of goods sold down to the last kopeck: fuel, salaries, depreciation, and time—for each trip, driver, and branch.

The route has been completed — but no one knows exactly how
Real-time logistics analytics tracks actual performance against plan for each route — including mileage, departure delays, time deviations at stops, missed stops, and uncompleted routes — by branch and by any metric.

There are more retail outlets, but revenue is falling
Profitability analysis of locations shows which locations are profitable and which are unprofitable — taking into account actual transportation costs. This serves as the basis for optimizing logistics costs by revising terms or discontinuing service to unprofitable customers.

There is no single overview — each branch has its own Excel file
The consolidated dashboard brings together all the network KPIs on a single screen. No phone calls, no manually compiled spreadsheets — just open it and see the results.
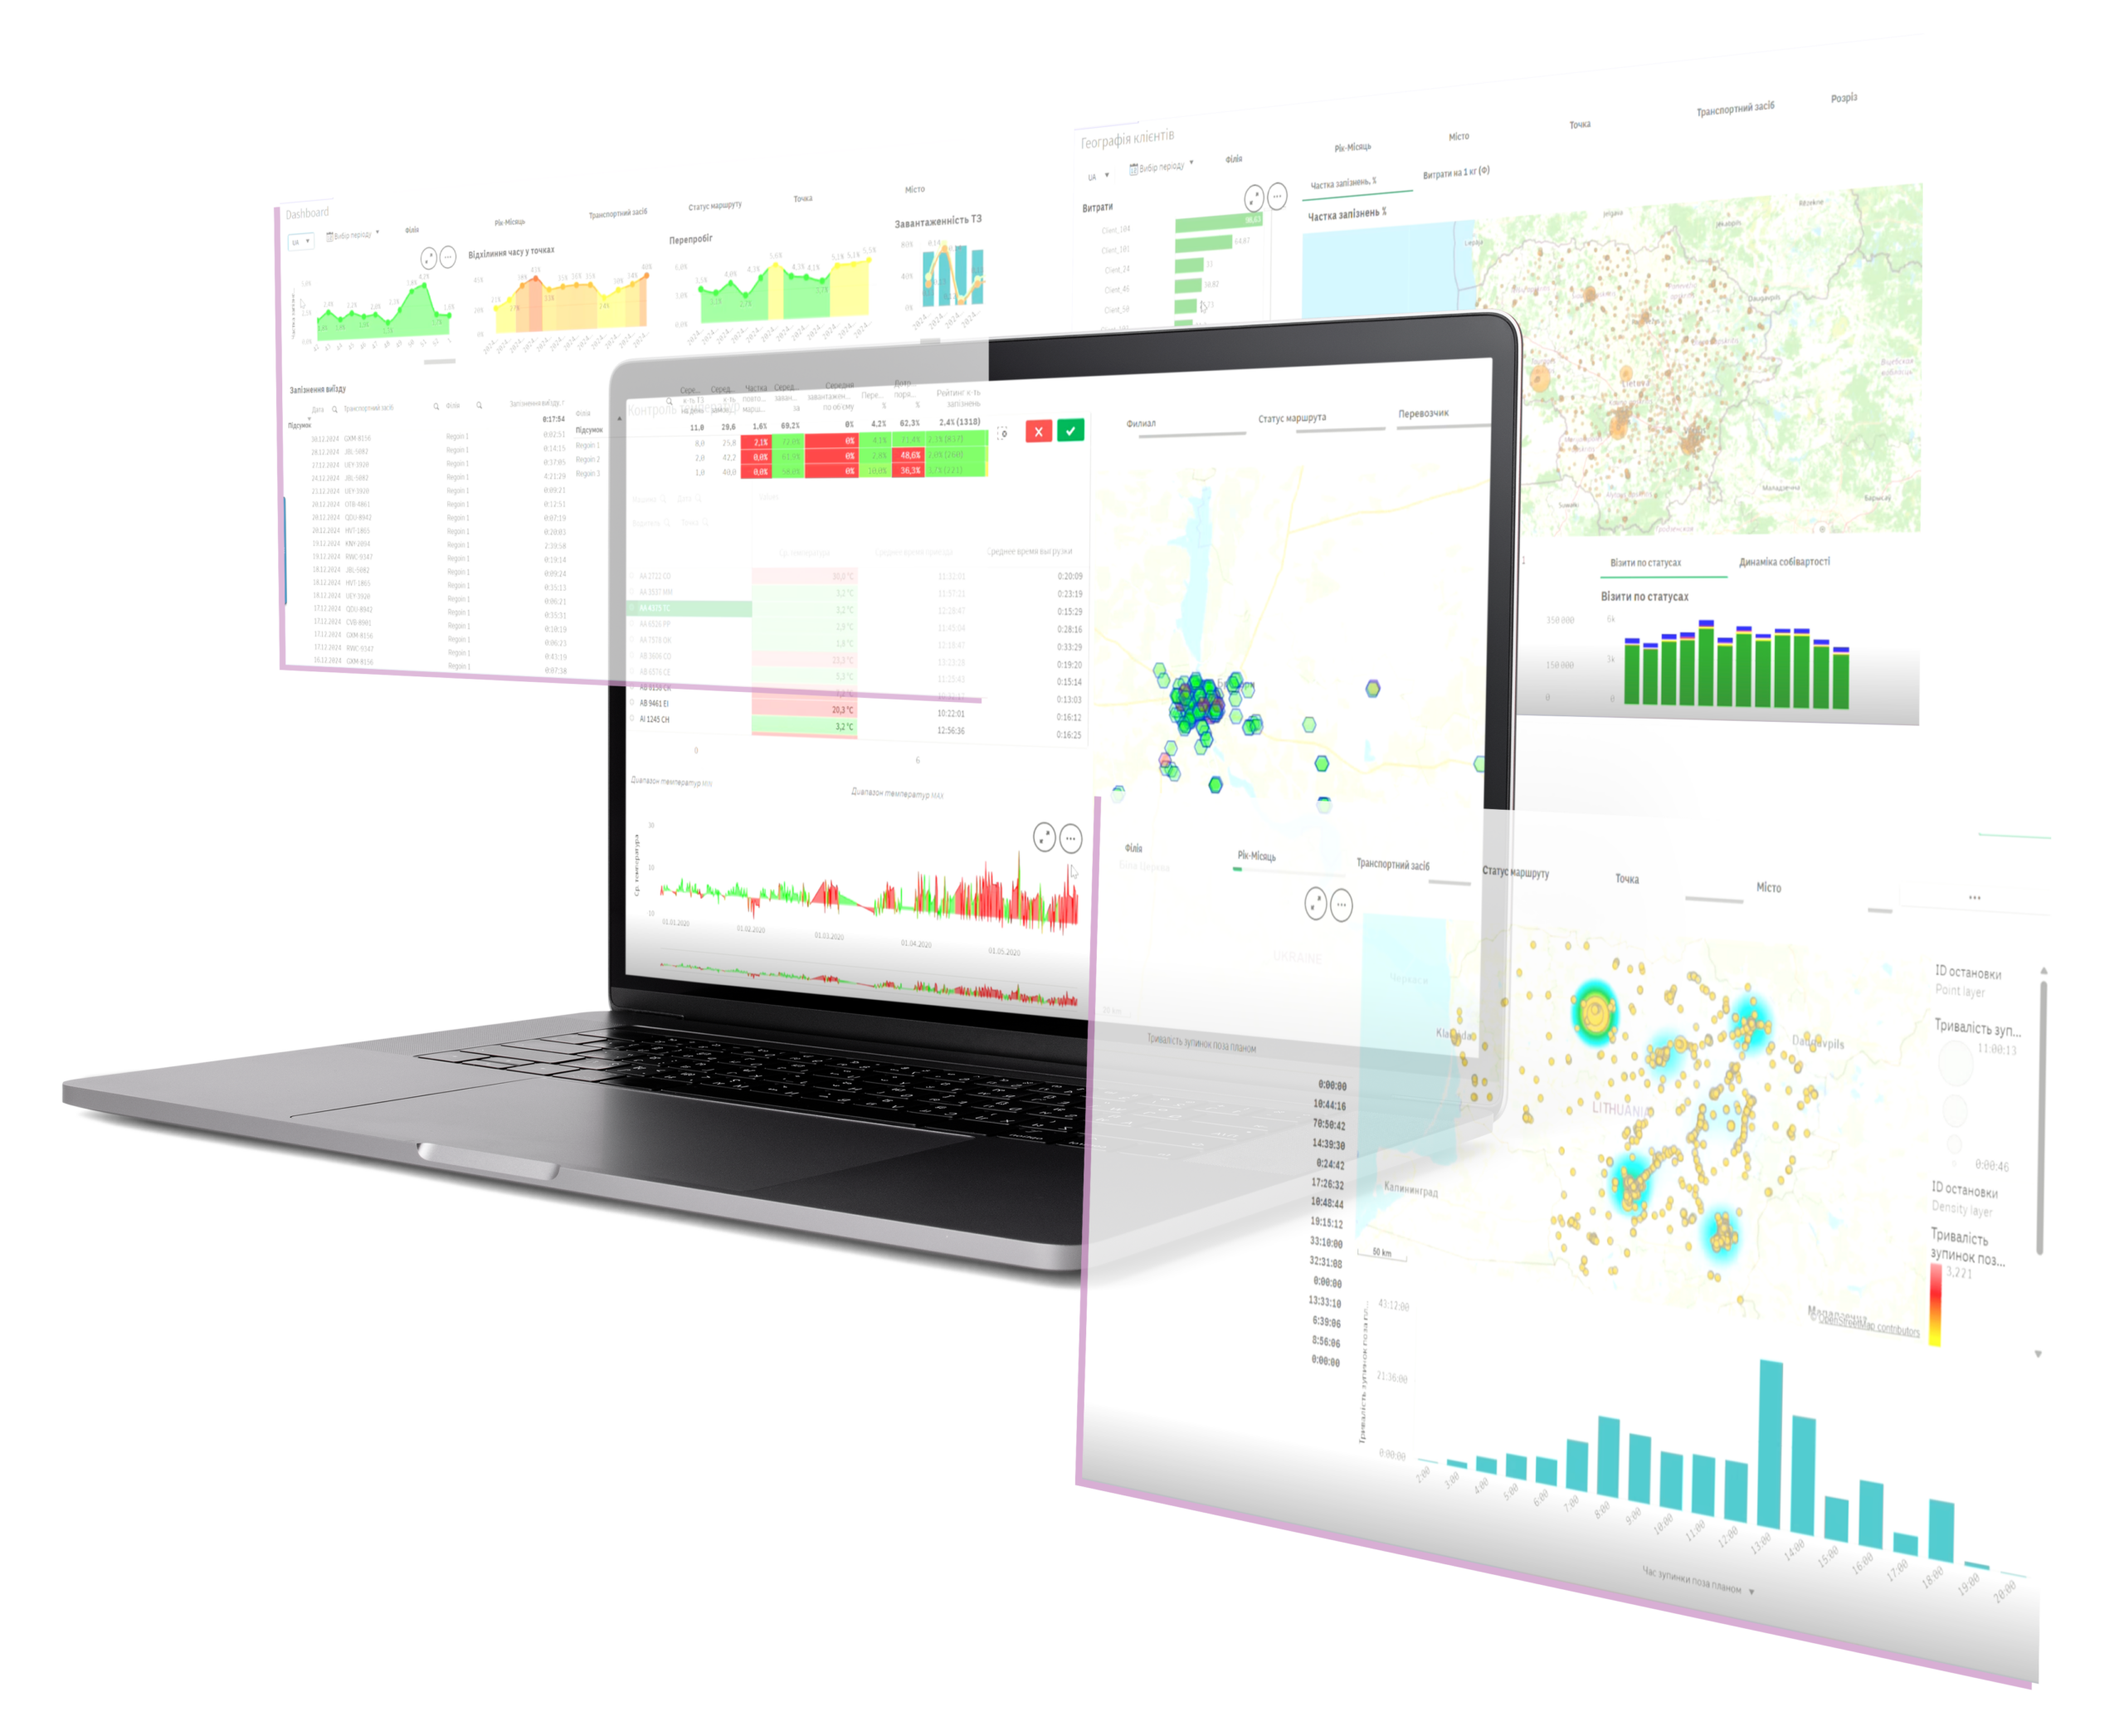
Analytics capabilities

One screen — a complete overview of the fleet's operations
Percentage of delays, time deviations at stops, excess mileage, vehicle utilization, departure delays, and branch comparisons — transparency of transportation costs all in one place, without having to switch between reports. Filter by branch, vehicle, route status, stop, and city. The set of metrics is flexible — you can collect exactly the data relevant to your company’s monitoring needs.

Plan vs Actual
Expense tracking for transportation companies across all branches: mileage, excess mileage in kilometers and as a percentage, adherence to the route sequence, late departures, time deviations at stops, missed stops, and route completion rates. You can immediately see where and to what extent actual performance deviates from the plan — for each branch separately.

Costs
Components of transportation costs broken down by customer and cost segment: per km, kg, visit, hour, and day — plan vs. actual. This shows which customers are the most expensive to serve and where costs exceed the norm. If cargo cost data is fed into the system, the total route margin can be calculated, taking logistics into account.

Client service
Percentage of late deliveries, average unloading time, planned vs. actual number of visits, and percentage of returns — for each delivery location, broken down by individual visit. A monthly trend showing improvements in service quality over time.

Drivers rating
An objective assessment of each driver based on system data: punctuality of visits, adherence to the route, excess mileage, missed stops, and speed. This can be used for more than just monitoring — companies pay bonuses based on KPIs from this report and share the rankings with the drivers themselves. The numbers eliminate subjectivity from any discussion.

Depot rating
Comparison of all depots based on a single standard: mileage, tardiness, adherence to the route, unvisited locations, and cost per kilogram. Color-coding immediately highlights where problems lie. This helps identify best practices and roll them out across the entire network.

Unplanned stops
A heat map and a list of stops not included in the route, with the duration for each vehicle. You can see exactly where and for how long a vehicle was parked outside of delivery points. If logistics specialists record the reasons for the stops, the system generates analytics based on those reasons and allows you to track trends.

Clients geography
Map with overlaid metrics: percentage of late deliveries and cost per kilogram for each location and city. Problem areas are immediately apparent — where service is poorer and where delivery costs more. Delivery segments and cost trends provide an additional perspective for analyzing transportation costs and reviewing rates by region.

Temperature control
The average temperature for each vehicle, tracked by time and route. The graph for the entire period collects data on every temperature spike — when it occurred, in which vehicle, and how severe it was. The system automatically records this information: in the event of a customer complaint or an audit, you have a complete body of evidence, rather than just the driver’s word.
Client results
Metro Cash&Carry is one of the world’s largest retailers, an international chain of wholesale and retail stores. Annual turnover is €63 billion.
%
Reduced shipping costs
%
Number of late deliveries
%
Sales growth in the first 6 months


Member of Coca-Cola Hellenic Bottling Company, which operates in 28 countries. It distributes soft drinks in the Czech Republic and Slovakia.
%
Reduced delivery costs while increasing sales by 7%.
%
Reduced delivery costs per 1 kg of product.
Switching to mileage-based charging.

KG Group is one of the largest business groups in the agriculture and food industry in the Baltic States.
%
Failure to deliver products on time
%
Utilization of transport capacity
Accessible route sheets and analytics


Qualiko is an international brand of chicken meat produced by MHP, one of the largest agricultural holdings in Europe.
Set up the logistics department from scratch
Logistician plans routes for 1,136 delivery points
%
Reducing the number of delays


Bidfood has been one of the leading distributors and wholesale suppliers of food products in Lithuania for 20 years.
%
Reduce delivery costs
%
Reducing the mileage
%
Reduction of the used vehicle fleet

Myronivsky Hliboproduct is a leading European poultry producer, accounting for 60% of all industrial chicken production in Ukraine.
%
Improvement in the tardiness rate
%
Reduction of unloading time at the point
Reducing the level of overruns

Smetanová cukrárna is a leading supplier of confectionery products to national and international chains in the Czech Republic and abroad.
%
Reduction of transportation costs
All drivers were provided with cell phones with the system
The quality of service was improved


Avangardco is a leading agro-industrial holding company in Ukraine that specializes in the production and distribution of eggs and egg products.
%
Reduced overrun rate
Reducing the number of tardies
Increase in the number of delivery points
A multi-brand distributor of alcohol. The company has its network of liquor stores – RUMKA.ONLINE.
%
Reduction in the percentage of under-delivery
Implemented SMS delivery notifications
%
Improvement in customer service


Epicur (Volodymyr-Volyn Poultry Farm) is a producer of chicken meat. The company has 11 growing sites and 100 poultry farmers.
%
Reduced delivery costs
%
Number of unvisited points
Improved hitting time windows

Engin is a regional leader in the distribution market of Azerbaijan. The company is an official distributor of Procter & Gamble, Selpak and others.
%
Reducing overruns
%
Increase in the average number of points per 1 vehicle
Increasing the level of customer service and loyalty

Lustdorf is a dairy company with more than 100 SKUs and 6 brands. The company’s products are sold in more than 25 countries.
%
Reducing the cost of delivery of 1 kg of products
%
Reduced average delivery time
Reduced planning time

Market leader in the production of sausages and meat delicacies. Plant is organised on the principle of a closed production cycle.
%
Reduction of vehicle fleet
%
Reduction of fuel consumption per unit of exported products
%
Reduction of transportation costs

Marshe is a large producer of meat, fish, bakery products and semi-finished products with its own supply chain.
The route planning time was reduced by three times.
%
Reduced shipping costs.
%
Reducing the number of vehicles.

Perutnina Ptuj is the leading producer of chicken and meat processing in the Balkans and has production assets in four Balkan countries.
%
Reduction of overruns.
%
Reduction of delivery cost.
Late delivery rate.
")

Concern Khlibprom PJSC is one of the largest enterprises of the Ukrainian bread market, which produces up to 160 tons of products daily.
Fully automated the route planning process
Increased the level of customer service
Implemented the analytics module


FoodEx is a healthy food delivery service for business people. The company has been delivering balanced meals since 2016.
Reduced time for route planning
Reducing the required vehicle fleet
Improving the level of customer service


Torgservice LLC is a keg beer distributor company specializing in wholesale beer and beer products.
%
Reduction of transportation costs
%
Reducing the number of vehicles
%
Decrease in planned kilometers
Who will find this useful
Director of Logistics / COO
A consolidated dashboard featuring key KPIs, cost trends, and profitability broken down by branch. This tool helps you make strategic decisions based on data rather than intuition.
Dispatcher / Route Manager
Real-time monitoring of route execution, deviations, and delays. Immediate response to issues even before the driver returns.
Chief financial officer
Total logistics costs, breakdown of expenses by category and department. Data for budgeting and identifying cost savings.
We appreciate you contacting us. One of our specialists will get back in touch with you soon. Have a great day!
FAQ
What is logistics cost analysis, and why is it important for businesses?
Logistics cost analytics is a module that collects, organizes, and visualizes all of a company’s transportation costs in real time. It answers a question that rarely has a clear answer in Excel spreadsheets: why do logistics costs what they do, and where exactly can this be changed? Without such a system, decisions are made based on gut feelings; with it, they’re made based on numbers.
What are transportation costs made up of, and how should they be properly accounted for?
Transportation costs consist of direct and indirect expenses: fuel, driver salaries, vehicle depreciation, time costs, and maintenance. The ABM Rinkai TMS analytics module breaks these down into units that are useful for decision-making—per 1 km, 1 kg, 1 visit, 1 hour, or 1 day. This is broken down separately for each route, driver, customer, and branch. This makes it clear exactly how the total amount is calculated and why.
What data does the system use to analyze transportation costs?
The system works with actual route data: mileage, time spent at each stop, number of visits, cargo weight, delivery statuses, and GPS tracking. If the company also provides data on the cost of goods, the system can calculate the total route margin, taking logistics costs into account. Dashboards can be customized to specific needs: you can add or remove metrics and change the breakdowns.