Effects
We focus on current demand in operational planning, not just forecasts, which leads to improved results


Improve business efficiency and inventory management

-
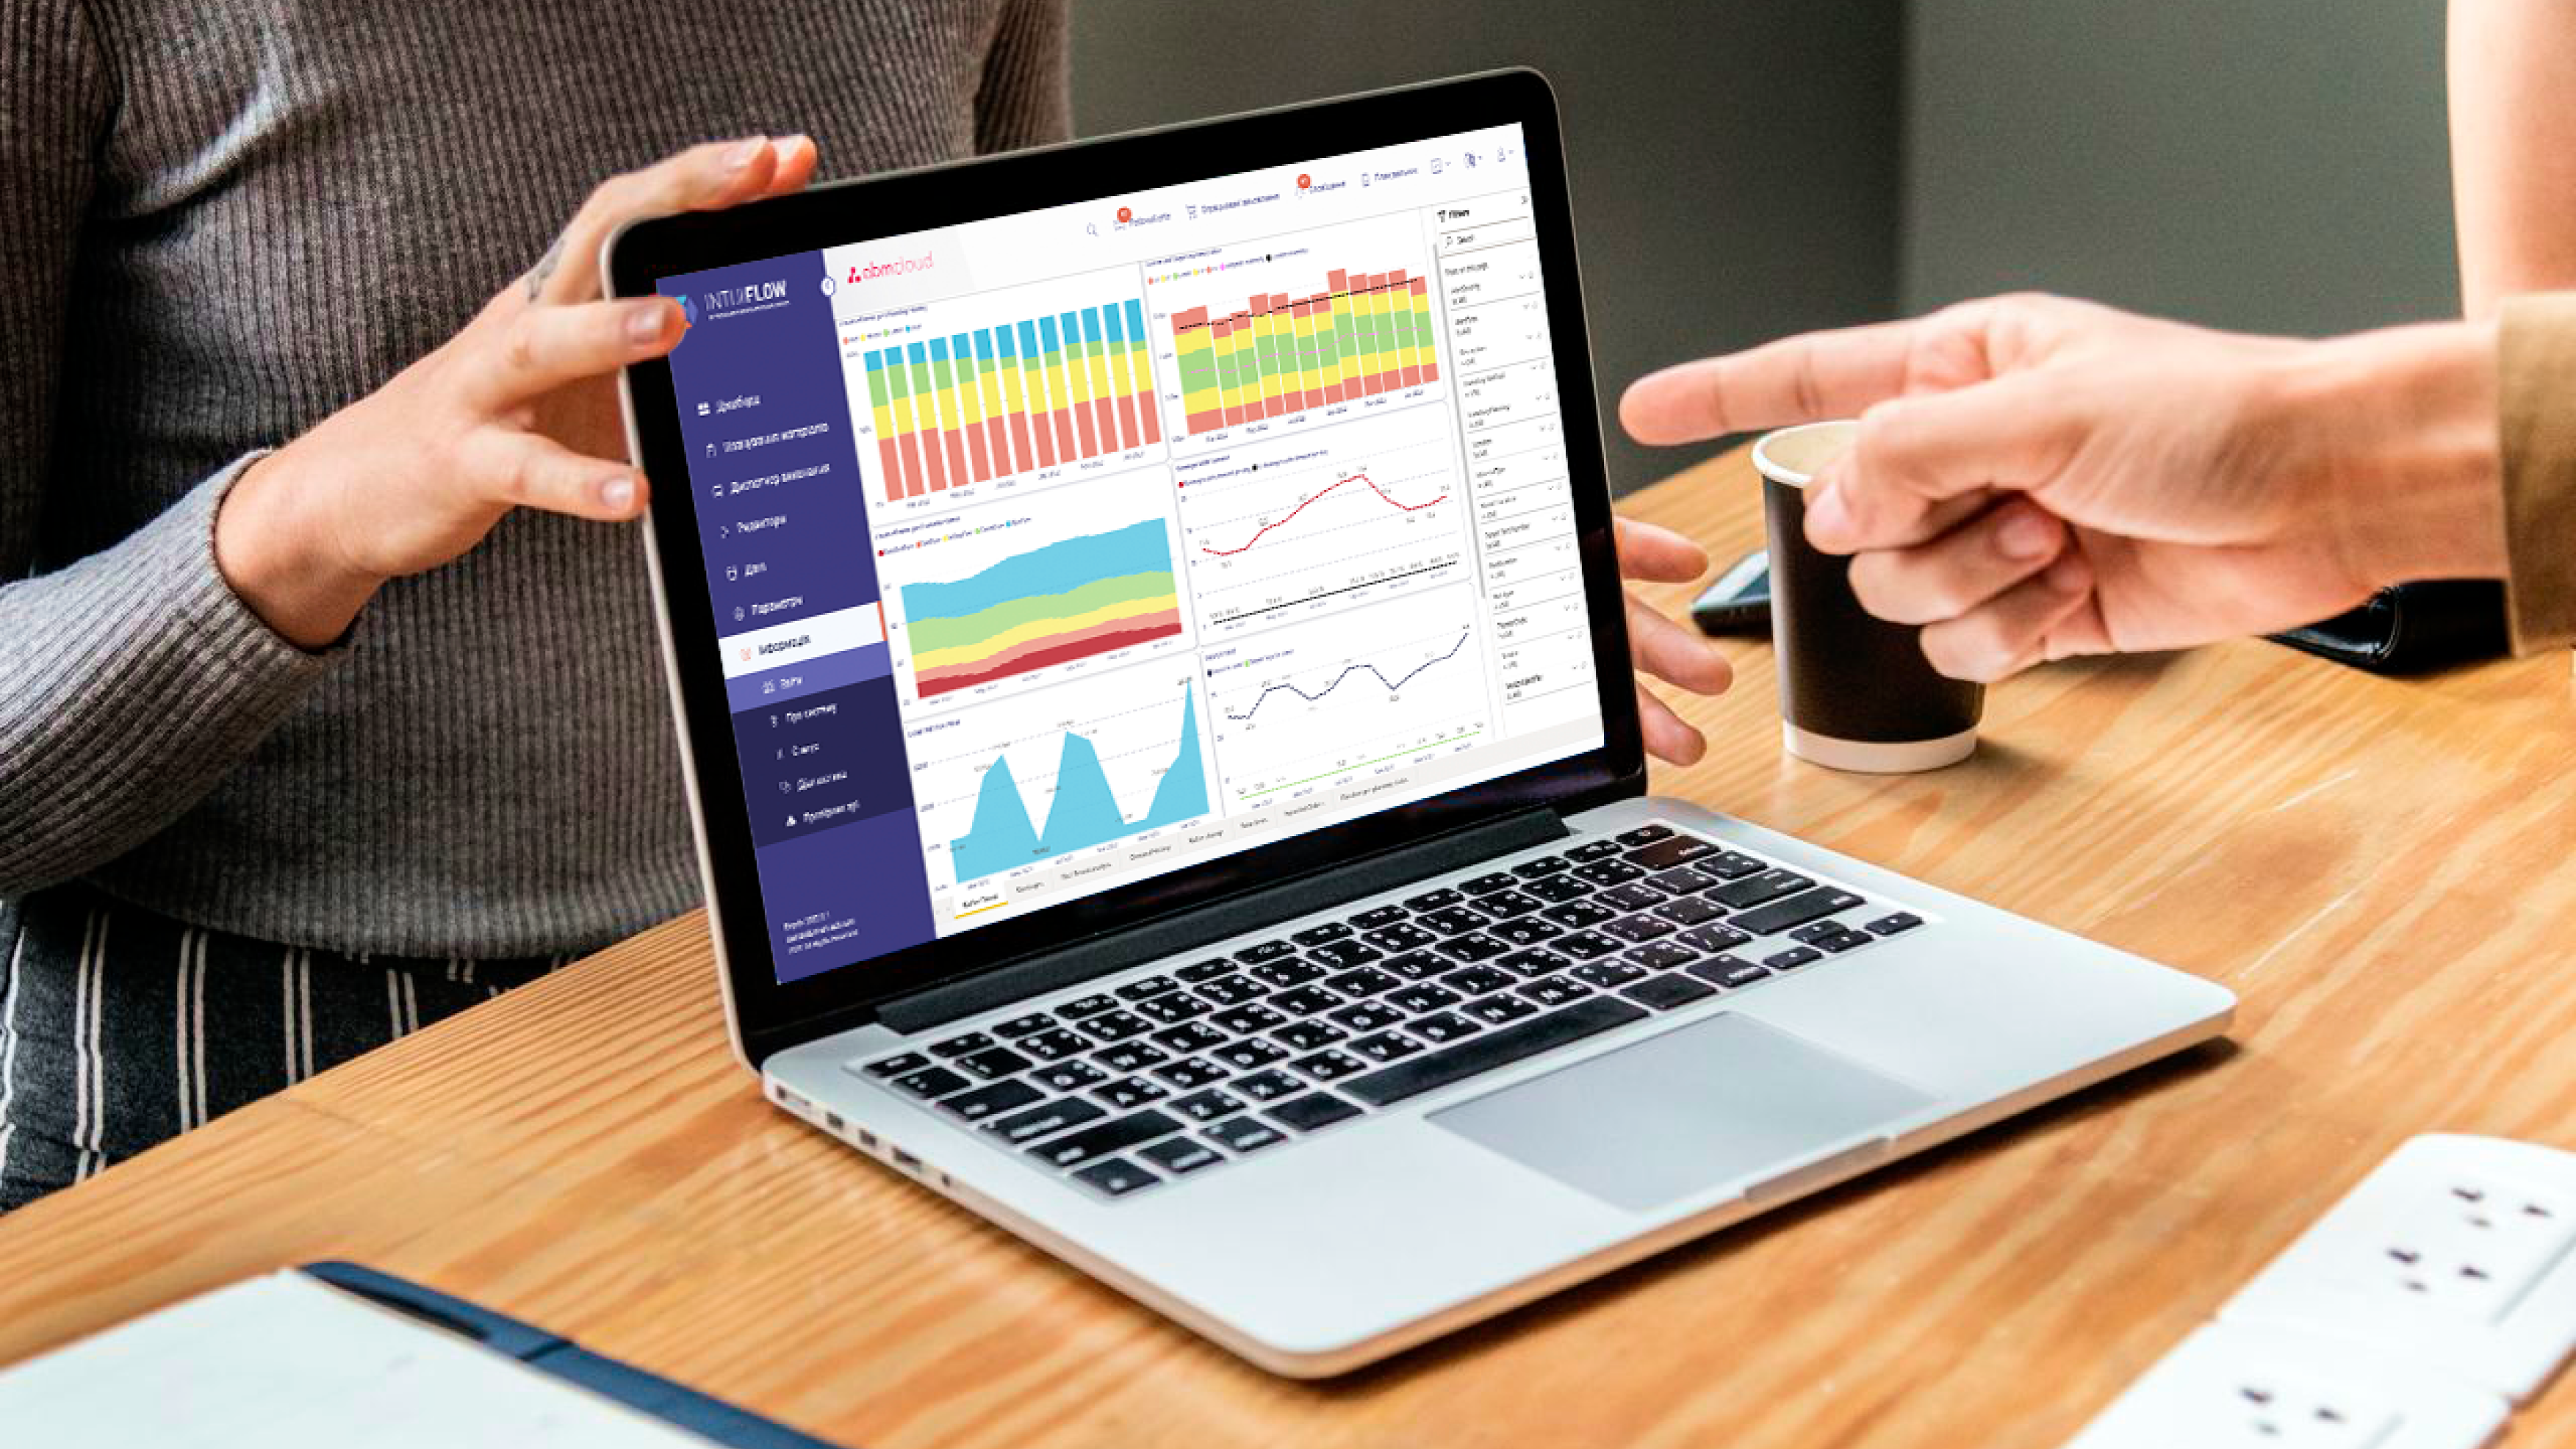
General information field
This is where planners manage their working day. Critical situations concerning stocks, orders, and overstocks are highlighted here.
-
Execution alerts
Situations that may arise after orders are approved, such as current inventory shortages, material synchronization processes, projected stockouts, etc. To resolve them, you have to make managerial decisions.
-
Tracking the status of the production
The manager can see the summary of work orders in real-time: their scheduling status, quantity, time and delays.

-
Automatic generation of the recommended order quantity
Systematic generation of order quantities based on the "Net Flow" equation and SKU-specific inventory management policy
-
Auto approving
Automatic approval of the system recommended quantity
-
The "priorities" system
Setting priorities allows you to easily evaluate what to focus on in the first place and account for the existing limitations of time, quantity, space, and capacity
-
Testing new inventory management models
Modeling capability: What average inventory will the system recommend if you change the cycle, minimum order, or other parameters? Prepare for a new season or promotions. How will the new supplier's work schedule affect your orders? Run the model with the new parameters of an alternative supplier or analogs. Create a new or modify an existing inventory management strategy, etc.

-
Automatic Generation of Order Recommendations for Production Planning
Systematic generation of order quantities based on the calculation of "flow balance" and inventory management policies for specific items.
-
Working with Items
Analysis of potential shortages, modification of components in specifications, adjustment of any item parameters, and the ability to model in case of changes in inventory management parameters.
-
The "priorities" system in inventory software management
Setting priorities allows you to easily evaluate what to focus on in the first place and account for the existing limitations of time, quantity, space, and capacity.
-
Workspace Customization
Managers can configure multiple individual "work views" to process: suppliers, countries, units of measure, product types, various classifications, and more.
-
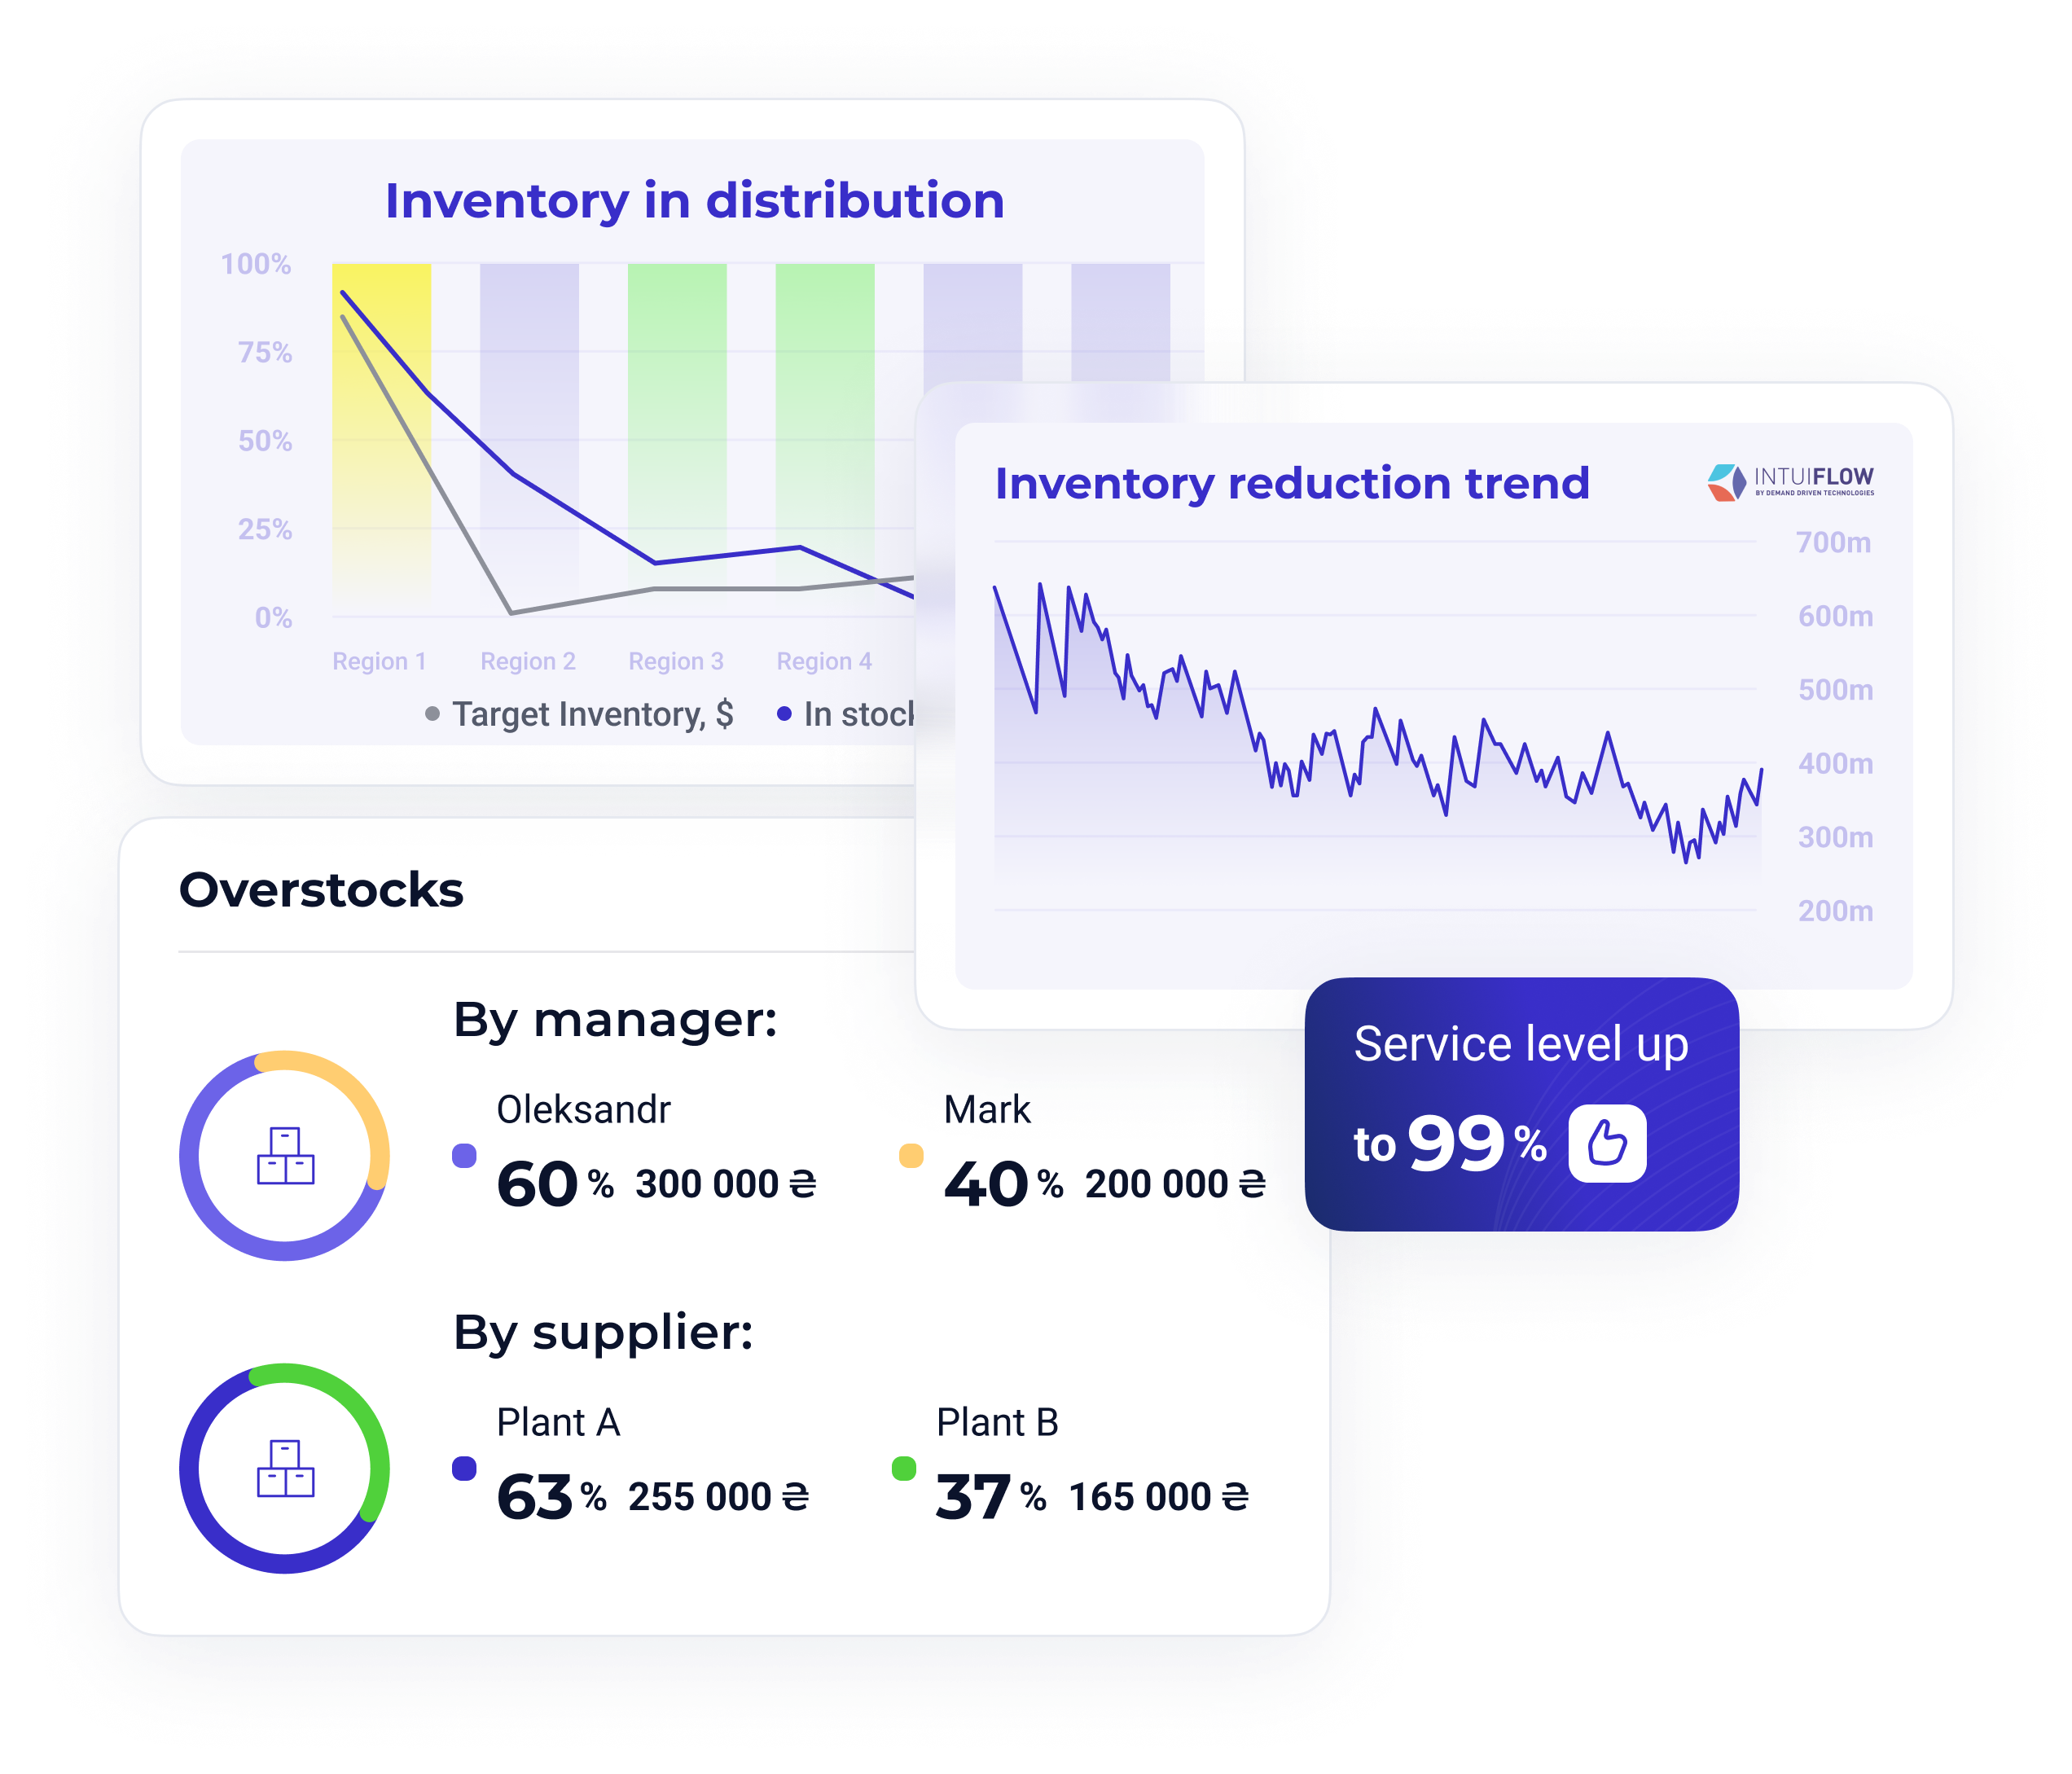
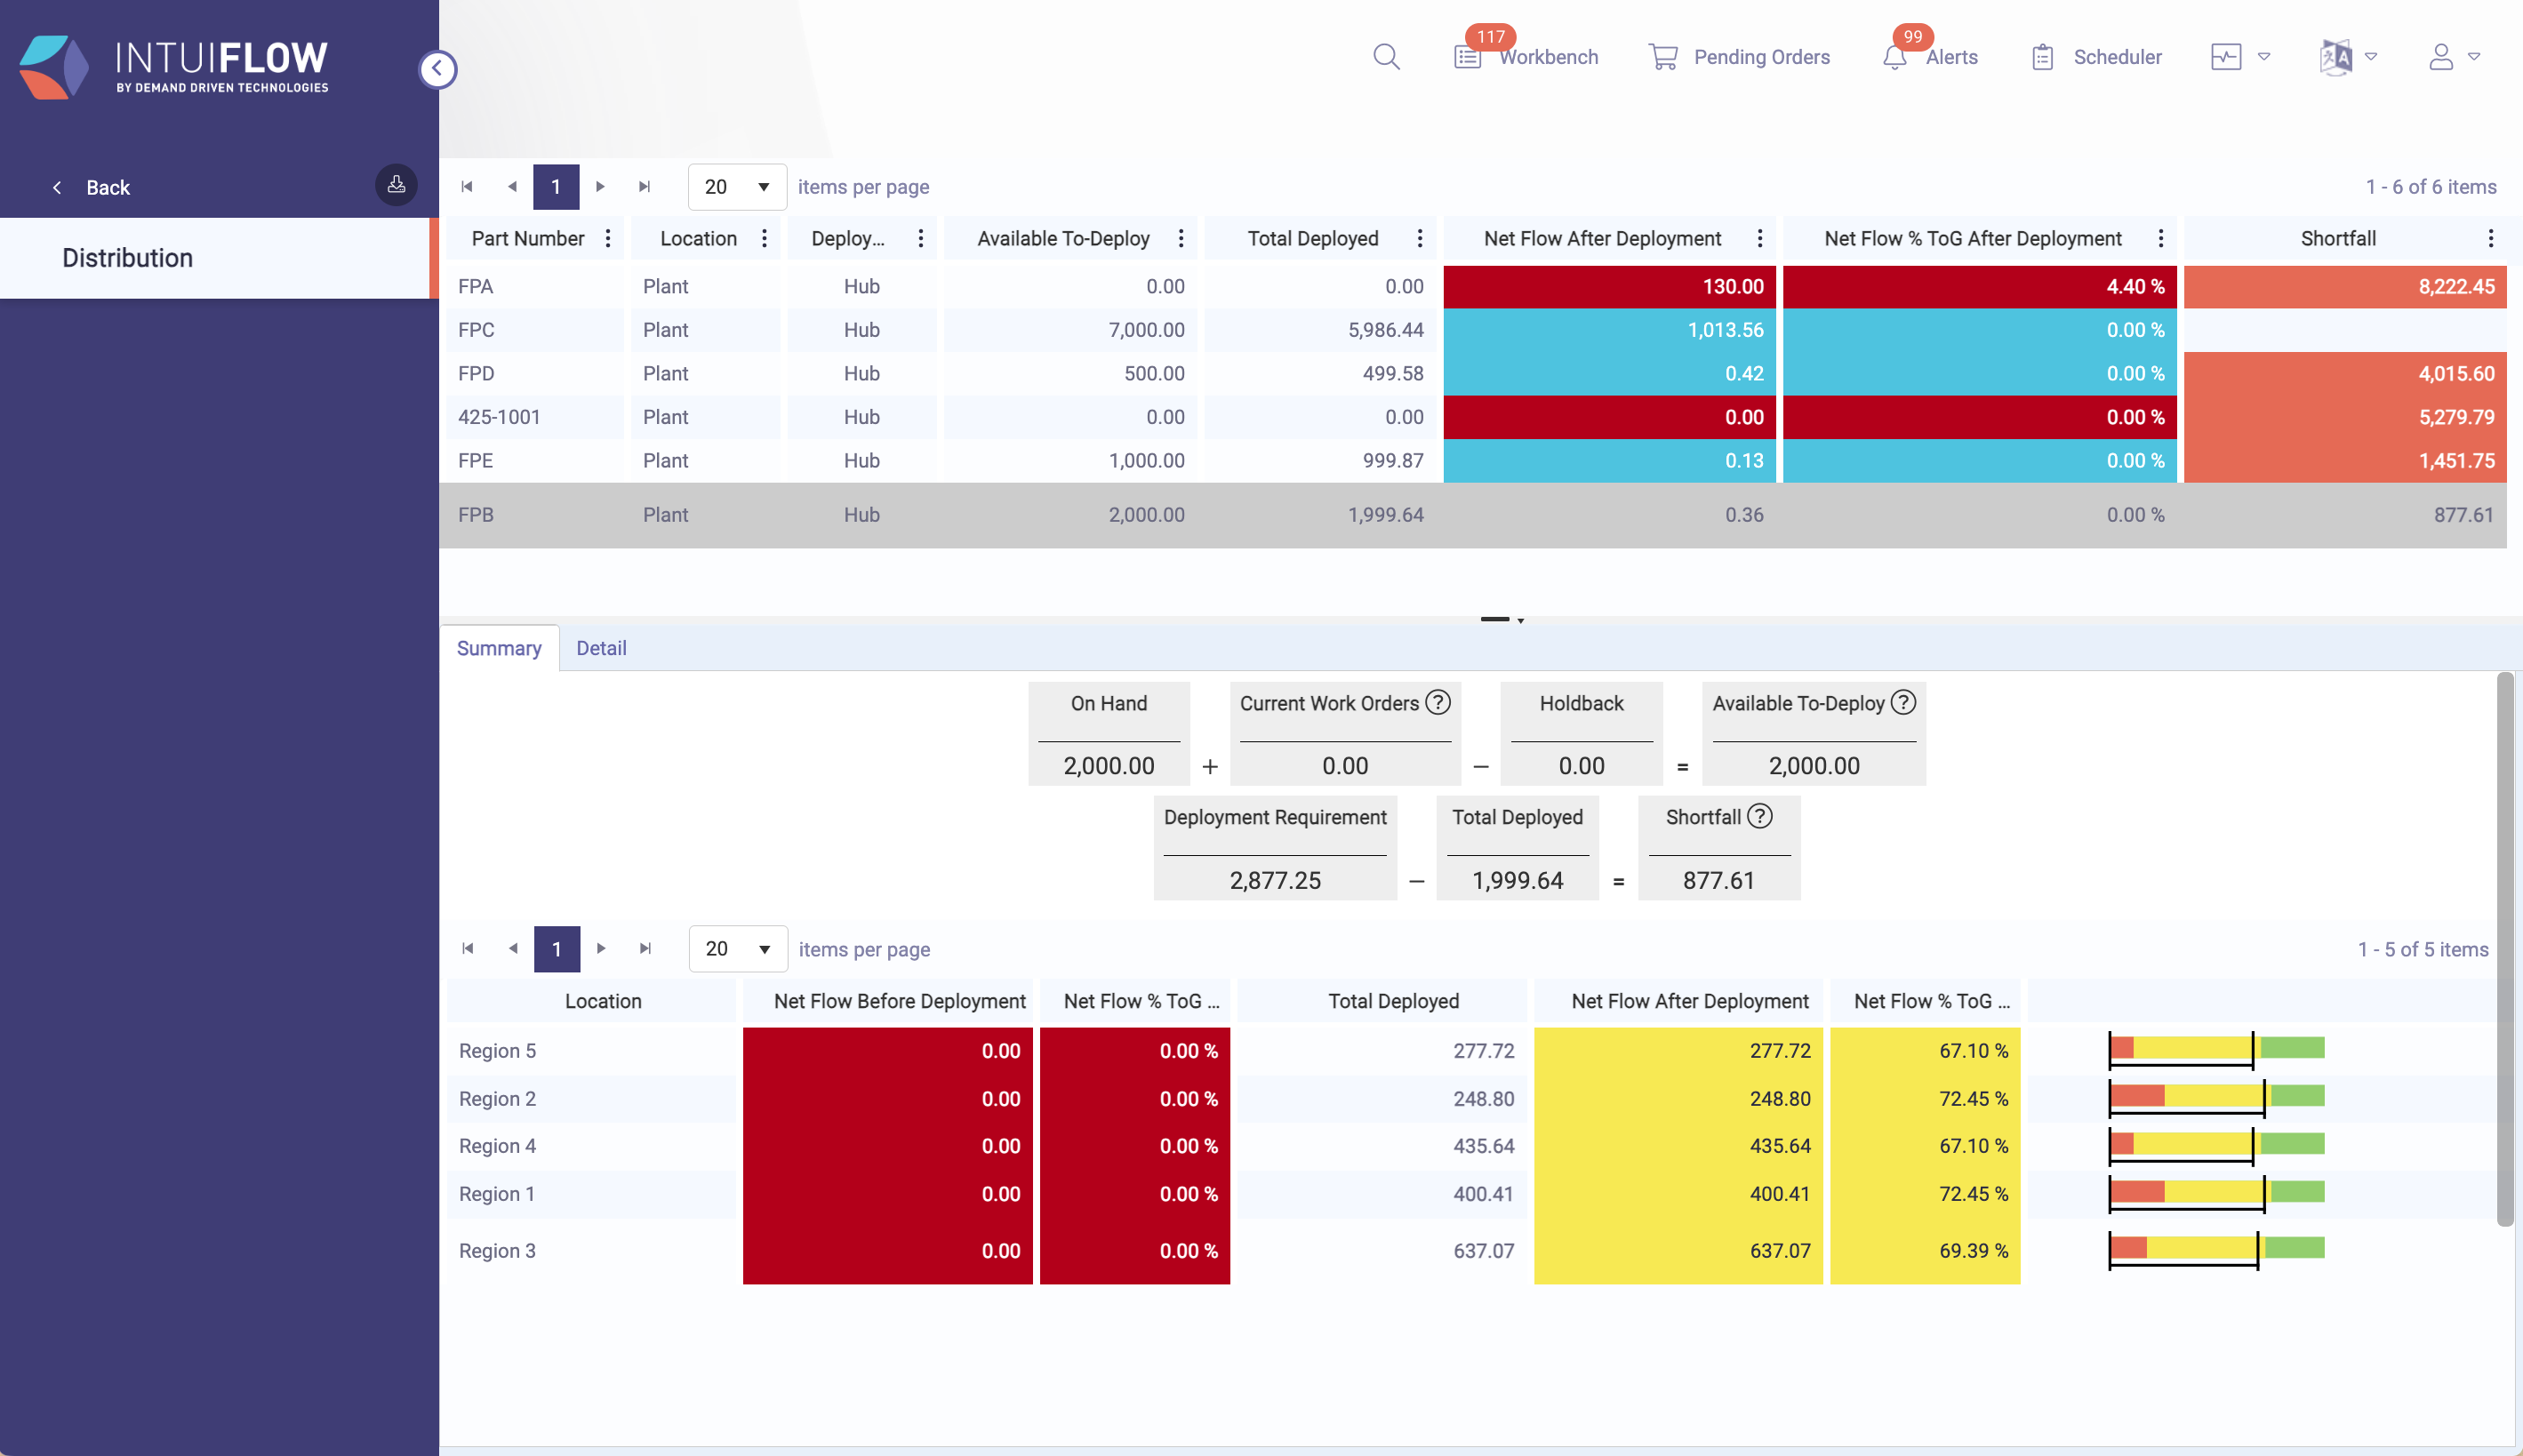
Inventory allocation in distribution
The system will analyze and evenly distribute the available stock from your hub to all regions/warehouses in the network while considering their consumption and existing restrictions.
-
The inventory software management visualizes the replenishment of the stock buffer
and tells you how much is still missing per each warehouse.
-

-
AutoPilot
The feature is dedicated to generating optimal item level settings for Buffered and Min-Max items in Intuiflow. The key user input to the Auto Pilot is the target Service Level by inventory classification, i.e., A, B, and C items.
-
Demand History
Another key prerequisite for the Auto Pilot to run. Based on this input, the Auto Pilot runs simulations to generate the optimal buffer size recommendations that would enable you to meet your Service Level targets.
-
-
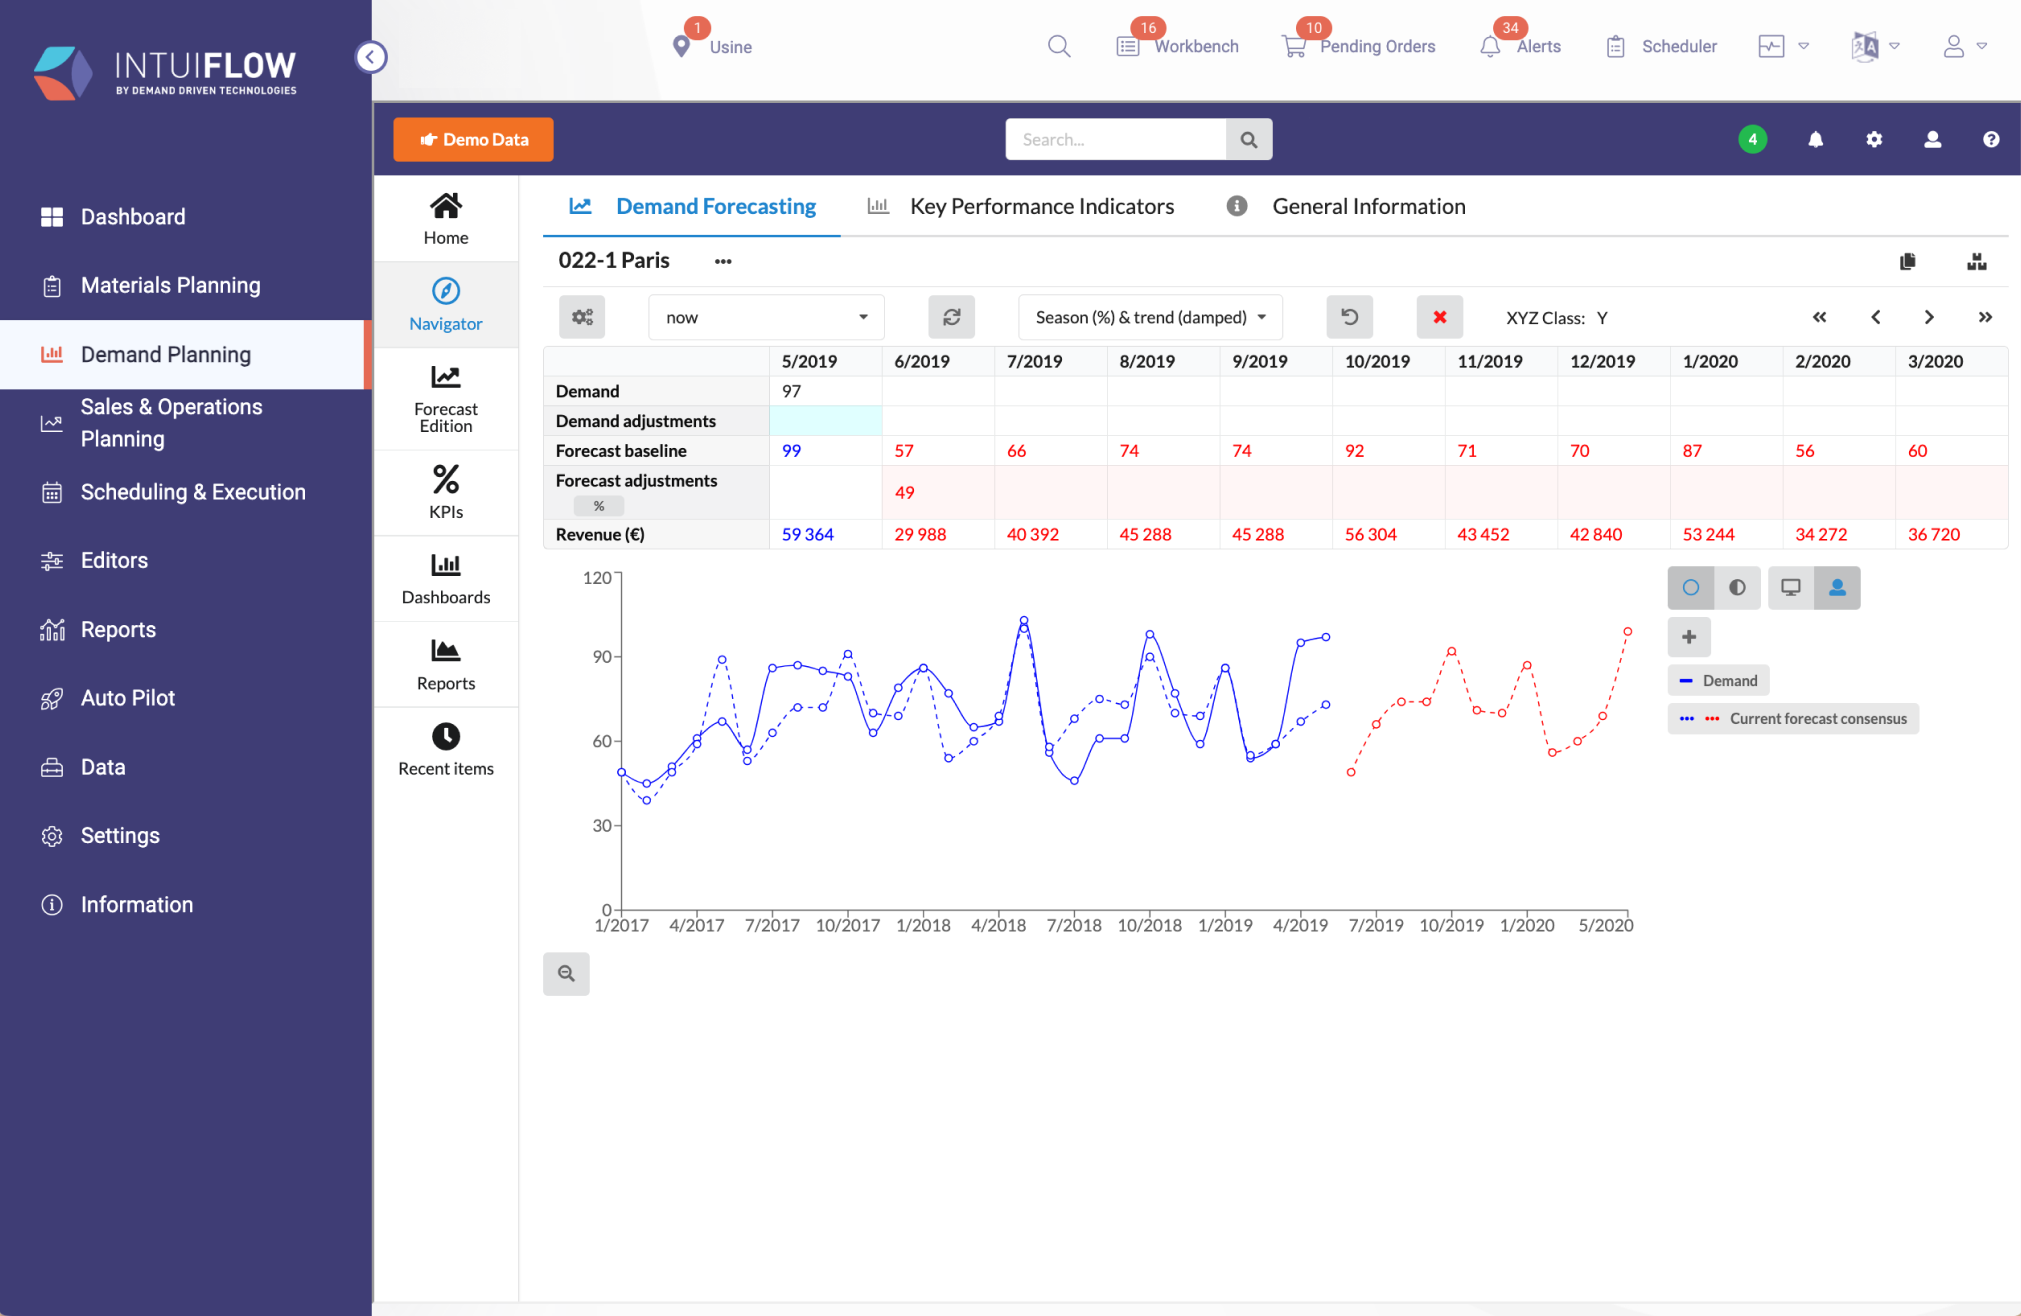
Accuracy and Bias
The system conveniently displays the accuracy of forecasts and the level of bias from actual data. This helps users understand how precise their forecasts are and whether they tend to overestimate or underestimate indicators.
-
Granularity and Horizon
Users can forecast at different levels of aggregation, from daily orders to annual sales planning. The system allows selecting the required level of granularity based on specific user needs.
-
Advantages of Forecasting
The forecasting block is valuable as it enables users to make precise forecasts at various levels of granularity and time horizons. Displaying accuracy and bias helps improve the quality of forecasts and make informed decisions considering the forecasted data.

-
Sales and Operations planning reports
The reports will help you to develop tailored tactics. Build a model of the future strategy and compare it with the operational level.
-
Rough Cut Capacity load chart
The chart simulates the projected capacity load based on your forecast and the orders generated from it.
-
Part Simulation
This is a tool that can help you run different scenarios for a specific part. Based on your forecast or demand history, the simulation will allow you to estimate the service level, SKU shortages, and average inventory.

-
Real-time monitoring
Monitor the current state of production facilities and each work order in real time.
-
Map your production flows
Identify bottlenecks to synchronize, analyze, and optimize production.
-
Monitoring the time load of each work center and shift
This is where you will find what orders are going into production, how much it loads the system and how long it is going to take as well as whether all production orders, for each of the work centers, have been taken up and completed on time.
-
System load graphs
These graphs provide extensive analytics and a transparent view of production facilities, both individually and for the entire system.

-
Analytics
Basic reports, as well as modern graphs and tables, are built based on the Power BI system to fit the needs of your team.
-
General dynamics of the inventory status
The amount of overstocks or out-of-stock and their dynamics over the period. The cost of your inventory. With the help of filters, you can drill down to the required level and locate the problem.
-
Dynamics of overstocks and out-of-stocks by managers
Reports generated by managers show where and who to focus on to achieve the desired results.
-
Power BI report designer
The designer helps you to create a variety of tables/charts/reports, etc., sorted by indicators such as supplier/warehouse/manager/order/stock or any other data.


Testimonials

View video
14minYUKO
In distribution, the size of the inventory did not seem excessive, but given the effective result of the methodology implementation in production, there were positive expectations for the implementation in regional offices.
Dmitry Vasiliev,
Chief Financial Officer

View video
19minFastPack
ABM Cloud impressed us by using a mix of state-of-the-art business management tools.
Irina Yurchenko
Head of Procurement Department
Kormotech
After INTUIFLOW implementation, the planning process became more predictable and the supply chain more transparent. It’s like a control board, where everything is always clear and available.

Monomakh
DDMRP has simplified inventory management. This was possible thanks to the team of like-minded people who are not afraid of changes.
Client results
-

In distribution, the size of the inventory did not seem excessive, but given the effective result of the methodology implementation in production, there were positive expectations for the implementation in regional offices.
2 xless inventory in the first 4 months
60%
increase in sales
25%
reduction in overstocks

-
")
Intuiflow has many planning options for SKUs, and different replenishment strategies depending on each SKU’s demand stability and variability
30%
decrease in overstocks
2 xshorter production lead time
45%
SKUs in the red zone decreased


After INTUIFLOW implementation, the planning process became more predictable and the supply chain more transparent. It’s like a control board, where everything is always clear and available.
%
production growth
%
reduction of finished goods inventory
%
sales growth with unchanged levels of total inventory


ABM Cloud impressed us by using a mix of state-of-the-art business management tools.
%
reduction in inventory
%
increase in OTIF, despite a 30% increase in lead-time of suppliers and a decrease in their service level
Automated inventory management


DDMRP has simplified inventory management. This was possible thanks to the team of like-minded people who are not afraid of changes.
%
increase in sales with unchanged stocks
%
reduction in overstocks
Orders for suppliers and production are automated

")
DDMRP is a systemic approach to purchasing, storing, and profiting
from non-capital assets. By applying
the methodology and following the recommendations, we managed
to halve the lead time of our customers’ orders
%
reduced customer order fulfillment time
%
improving turnover by increasing sales
Optimizing supplier order management
Intuiflow integrates with all ERPs

How is the inventory management software implemented?
01 Express diagnostics
02 Training
03 Implementing the system
04 Support
Business Process Diagnosis and Data Collection:
Project Framework and Goals Analysis:
Identification of Missing Data:
Data Formalization and Update in Accounting System:
Team Identification:
Training Planning:
Internal Communication:
Basic Understanding of Methodology:
Integration Setup:
Data Preparation and Functionality Testing:
Industrial Exploitation:
Settings Optimization:
Technical Support:
KPI Monitoring:
Planners' Work Analysis:
System Update Training:
Solution for inventory management is suitable for various industries
-
 Food and Beverages
 -
Pet Food
-
DIY
-
Chemical Industry
-
Pharmacology
-
Cosmetics
-
Automotive
-
Metal industry
-
Building Materials
-
Packaging
-
Household Appliances
-
Clothing, Footwear, Accessories


Your business results are our mission

Intuiflow software integration
We offer a comprehensive cloud-based inventory management solution that allows integration with various ERP systems. We also provide a user-friendly interface suitable for different industries

Automation of routine tasks for ordering
Shift the focus of managers' attention away from improving inventory management. We customize the optimal visibility of key factors for ordering for you. With transparent prioritization and alerts, it's easy to identify and respond to critical inventory situations
Built-in algorithms of the system's operation
These allow you to respond to demand trends, increase the company's efficiency, have a certain level of forecast accuracy. Inventory management should be simple and intuitive

High-quality support from Customer Success
After the implementation project, the client gets a manager whose task is to assist in improving the efficiency of the client's business. As a result of coordinated joint work on inventory optimization, overstock are reduced, shortages are minimized and the ordering process is improved

Increased business profitability
One of the effects you achieve with our solution is an increase in ROI and service levels because materials and finished products are available at the right place, in the right quantity and at the right time

Analytics
We offer order management and complex analytics (Power BI reports) among the core functions of the system. We promise to improve your team's decision making with Intuiflow's robust reporting.
Intuiflow Pricing
Number of production and warehouse sites
The number of locations to be managed within the software is determined by the number of production sites or warehouses. This affects the structure of the settings and ensures accurate inventory management at each stage. If you are looking to buy a production inventory management program, it is important to understand how many locations need to be processed.
Number of Parts
The number of different Parts at each location, including finished products, semi-finished goods, raw materials, and packaging directly impacts the complexity of software setup. A larger product range requires more data and processes to manage inventory. If you need to buy a program for managing production inventory, this aspect will also have an impact on your choice of software.
Inventory Trends
When calculating the implementation cost of the inventory management software, key indicators that reflect the trends of your inventory are considered. The more information that needs to be processed, the more server resources and specialists will be required to work with the software.
Additional process settings
The better digitized the processes within the ERP are, the faster and more efficiently the project progresses. It is essential for the data in the ERP is up to date and properly structured, as this ensures seamless integration with the software.
Digitalization Level
The company's commitment to the implementation of digital solutions has a significant impact on the project. If processes are not yet automated, more time and resources will be required to migrate to the new software. However, if the company already has automated processes, the integration of the new software will be smoother, allowing for faster results.
Project duration
The duration of the project depends on the complexity of the company's internal processes, the level of change approval within the organization, and the number of managers involved. If the company has multiple approval stages, such as with other departments or management, this may impact the time required to implement the project.
ABM Cloud Solutions Ecosystem


Inventory Management Guides

- Which KPIs should I choose to evaluate the efficiency of inventory management? How to calculate them?
- Which of their behaviors should be considered positive and which of their behaviors should be considered negative?
- What should you focus on to achieve the effects?
The most frequently asked questions
about the INTUIFLOW inventory management software
Is the system only suitable for manufacturing?
The system allows you to manage planning, procurement, production, distribution, and inventory management at the final points, fully covering the entire supply chain.
Which ERP systems do we integrate with?
We integrate with any ERP system, like SAP, Oracle, Microsoft Dynamics, and other common ones. Our solutions are easily adaptable to various platforms.
Is Intuiflow a Ukrainian inventory management system?
It’s an American solution developed by Demand Driven Technologies company, we are their official representatives. The system supports 15 major languages, including English, Ukrainian, Spanish, French, etc.
What is the typical project implementation timeline?
Project implementation typically takes between 5 to 18 months, depending on the business specifics and scale, which can vary from a single manufacturing site to multinational corporations.
Who should be involved in the implementation process?
We recommend to involve an IT specialist, Project manager, and department leads who will use the system, such as Procurement, Sales, Warehouse, Distribution, Production, etc. Additionally, software users should be involved in later stages.
Is training provided to employees before system usage?
Yes, we provide comprehensive training for your employees before launching the system so they can effectively use all its capabilities. The training is systematic and automated through an LMS, creating a unified knowledge base. This ensures proper onboarding for new managers and users and forms a team of interchangeable experts.
How often are new versions of the system released?
Updates are released on a regular basis, and the system can be upgraded monthly or upon request. This ensures that your system functions remain up-to-date, and your data is secured.
Is there a technical support department, and how does it operate?
Yes, technical support is provided by our vendor. Additionally, ABM Cloud’s Customer Success team maintains communication with clients, ensuring the smooth operation and effective usage of our solution.
Can you maintain the required level of data security?
The security level is confirmed by the international ISO 27001 certification: ” Information security, cybersecurity and privacy protection — Information security management systems — Requirements” and SOC 2 certification, ensuring enhanced data security, control, integrity, and confidentiality.
We appreciate you contacting us. One of our specialists will get back in touch with you soon. Have a great day!
Explore production efficiency
Read our articles to learn how automating business processes with Intuiflow can optimize your company's operations, reducing costs and increasing production efficiency

Cloud inventory management at Monomakh Tea Production: Achieving a 59% Sales Boost
TOP 3 steps for effective change inventory management