How to define the Economic Order Quantity. Success story retail

If your company deals with the small business, then it will be quite simple for you to define the economic order quantity manually. However, in the wake of business growing, you should consider the issue of investing into the inventory management system in order to control your reserves more efficiently.
There are many reasons why business has to invest into the system for calculating the economic order and all of them go beyond the scope of simply monitoring the in-stock level. A large retail chain from the Eastern has faced the main prerequisites and reasons for investing into the automated inventory management system.
The company received excellent results of the project:
- Turnover accelerated by 1.5 times.
- Loss of sales fall by 39 %.
- Surplus fall by 21 %.
About the company
Company in the retail sphere from the Eastern region numbers about 20 stores. Company has in-house production: pastry shop, bakery. There is its own distribution center and a warehouse.
- Total sales premises – over 6500 sq.m.
- Total active SKU amount– over 11 000
- Number of system users – over 30
- More than 500 promo offers every day
Economic order quantity, delivery schedule, inventory level and other prerequisites
The economic order quantity is often determined manually in companies according to the different interpretations of Wilson formula.
At the moment of pre-project inspection of the chain, a formula was included into the economic order quantity model that was focused on sales forecasting. All the chain orders were formed in semi-automatic mode with the help of accounting system ERP8.2 according to the “min-max” method, which increased labor efforts and reduced quality of orders; one goods were in surplus, while the others – in shortage. Delivery schedules were conducted by managers in Excel and during the placement of orders, managers accounted this information in manual mode. Also, there hardly was a possibility to estimate the surplus commodity stocks and causes of their occurrence in the system.
With the purpose of effective activities of trading company that is a client, two conditions should be fulfilled: on the one hand, to ensure profit by reducing commodity stocks, by not selling goods at discounted prices, by delivering with more expensive and faster mode of transportation, and on the other hand – to increase sales by keeping more commodity stocks, by selling at discounted prices, by delivering with more expensive and faster mode of transportation. In order to satisfy both conditions, the chain needs to define the economic lot of goods, to ensure the constant availability of the right product in the right place at the right time, and thus have no surplus of goods.
In order to streamline the workflow of the chain and improve financial ratio, the TOP management decided to launch the purpose-built solution for the Inventory.
Reasons of choosing the system to define the economic order quantity
In order to choose the program for Inventory and autodetection of the economic order quantity, the market was analyzed and the company brought an outside consultant to estimate the system possibilities. After the detailed survey of the product’s main features, the company decided to choose the ABM Cloud solution, which used the methods of the Theory of Constraints (COS) in its operating procedures.
TOC Solution for distribution and retail is based on two arrangements:
- Supply to provide in-stock;
- Create and support the trusted system of distribution, which is focused on the provision of in-stock.
Compared to the classical model of stock replenishment due to the sales forecast, TOC uses the notion of «reserve buffer», which is indicative of the necessary and sufficient stock level at each storing point for each managing unit, as well as a dynamic change of this reserve depending on the zone of surplus location.
TOC methods are used in operating procedures of the automated system of ABM Inventory. The system ensures the following:
Supporting the shelf inventory capacity at the established level, which provides constant availability of goods with the optimum inventory in the system. This is achieved by means of automatic execution of the following processes:
- Order planning
- Order placement
- Estimation of an economic order quantity
- Order optimization
- Order sending
- Periodic updating of the desired storage level
- Economic justification of the supported level
- Monitoring the inventory status
- Assortment management (by means of defining the least demanded by users’ positions, as well as defining the positions of the ordered assortment that are in stable demand for including them into the regular assortment matrix)
- Large-scale analytics regarding the inventory status and its influence on the business financial ratio.
Apart from the methodological component, the important argument to decide in favor of the ABM Cloud system was the possibility of using the program as the service, the SaaS model. The product’s cloud model does not assume the system’s purchase and its installation on users’ computers; payment is made every month based on the pay-as-you-go option. It gives a substantial saving: no need in capital investments into the product, no additional expenses on expensive equipment and supporting the system in operating condition. Company gets access to the system that is installed on the secure servers in the data-center, where all the calculations and working processes with inventory and orders are happening.
Project description
Before starting the project, the following objectives to be achieved were stated:
- Define the economic lot of goods
- Reduce the inventory surplus and optimize the assortment;
- Improve the company’s turnover ratio;
- Automate the orders;
- Optimize the personnel’s working time by means of automating the working processes with the stock and orders.
All the main categories of goods, except the group from the Fresh-segment were included to the ABM system of Inventory during the project. At present, 332 suppliers and near 108 000 product positions are monitored by the system.
System places automatically from 150 to 200 orders every day to the central warehouse depending on the agreed schedule of orders, as well as from 500 to 1000 orders to the outside suppliers, whereby near the third part of these orders (28%) are sent to the suppliers without participation of a manager, while the rest of the orders are corrected less than to 20%.
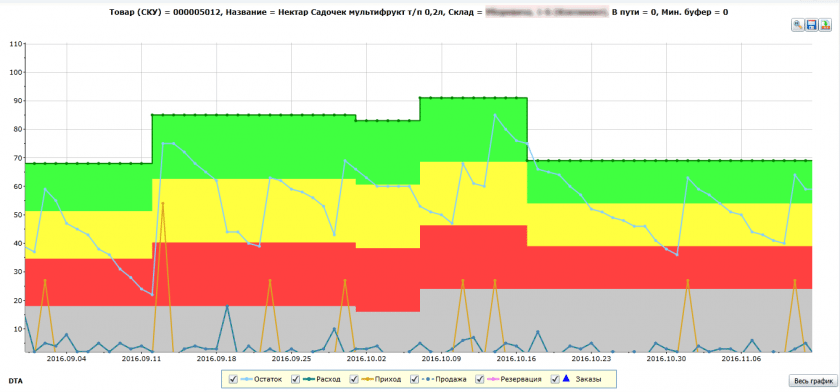
A separate level of surplus (buffer) is determined for each SKU at each storing location during the connection. This buffer is estimated on the basis of consumption from this element and from the delivery schedule. After several cycles, the system changes the buffers automatically (or after manager’s approval) due to the actual consumption (not forecasted). This mechanism is called the Dynamic Buffer Management (DBM) and is one of the main tools in the inventory management based on the TOC methods. The economic order quantity is visible in the diagram.
During the process of connecting the inventory management system, managers made the correct filling of product characteristics in the commodity and accounting system 1C, as well as draw the planograms (as this information can be automatically accounted in the process of order placement). Thanks to these systems, discrepancies between shelf display and sales were revealed and corrected. It enabled to improve the stock turnover ratio: the turnover of shelf was expedited from 32 to 20 days, while the data of its turnover were used during negotiations with suppliers for the underlying rationales of marketing payments.
Near 30 % of all the assortment is delivered to the shelves without its storage in the distribution center; it was implemented in the system using the Cross-Docking practice. This functional allows using the warehouse area more effectively, whereas the supply procedure does not become complicated for the supplier by means of delivering goods to the selling points, i.e. the system is mutually beneficial either for a supplier or for a buyer. Besides, a load on the warehouse and logistic expenses are decreased, while the storage area is used more efficiently.
In order to focus the specialists’ attention, the main measures of the inventory management efficiency – surplus, loss of sales and turnover – are displayed on the main screen of the system. Loss of sales is the indicator that is difficult to be estimated, though it is easier to be revealed visually, while loss of sales is the unrealized sale due to a product being out-of-shelf and which is affecting mostly the impression of the store.
Monitoring the dynamics of surplus and loss of sales, as well as the causes of their emerging, especially in the TOP-Mover (goods that are generating 80% of the company’s turnover or more), new goods, goods at discount prices is one of the manager’s key functions, as an optimal solution to a problem can be found only by defining its cause. You can go from the main screen to the list of problem positions and focus on them.
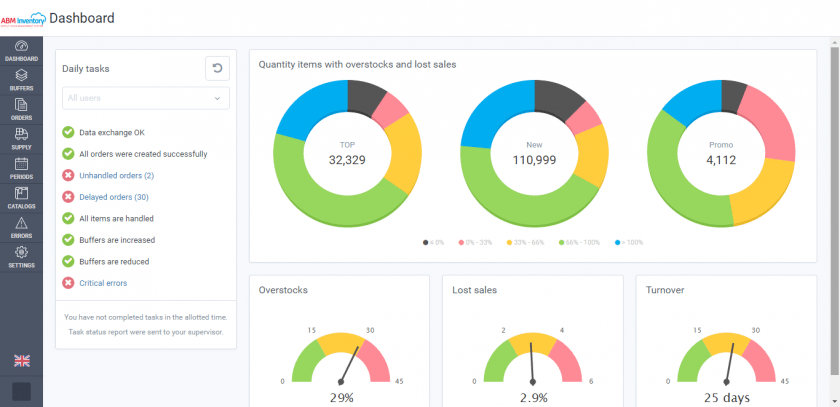
|
TOP-goods | New goods | Goods in periods |
| Loss of sales Risk zone | Optimal zone Safety zone |
Surplus |
| All surplus, UAH | Loss of sales, UAH |
Turnover |
Inventory management indicators on a manager’s desktop
Company performs an active marketing policy, which includes promo offers and clearance sales in order to attract clients. Also, sales of some goods have prominent seasonal fluctuations. The ABM system offers the procedure of splash scheduling to manage such commodity items; this procedure is widely used by managers in their everyday work.
The economic order quantity, delivery schedules and data of the minimal ordered amount are indicated directly in the system; it enables to change them right after receiving new information from supplier and place an order according to the updated information.
The ABM system, besides its direct function – automatic order, helps also to control the inventory management efficiency with the help of accounting system. The system generates near 30 reports on different processes of inventory management: correction of sent orders by managers, the economic order quantity, fulfillment of orders by suppliers, goods with surplus stock level, loss of sales, derived data from the assortment, etc.
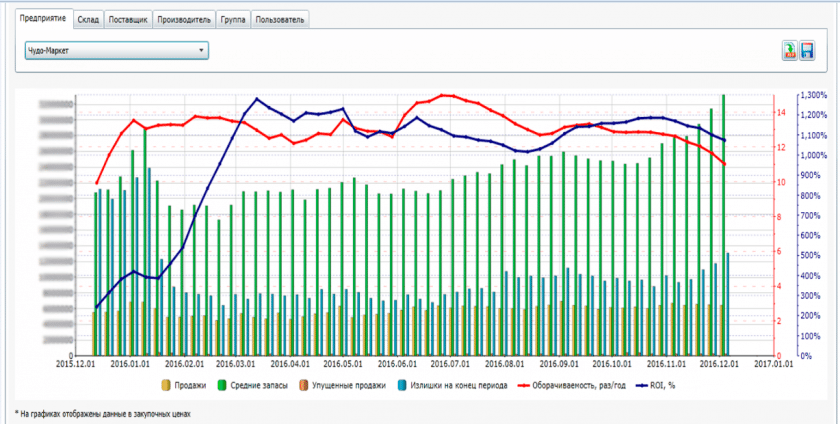
Specialists of the client company use the report on stock movements either in the whole company or in the warehouses or suppliers in order to assess the work performance. The schedule contains information about all main key indicators of inventory management efficiency – surplus, loss of sales, level of left-over stock and sales, as well as turnover and ROI. Towards the end of the year, the chain stock increased in some way due to the opening of a new store, as well as the advanced increasing of stock by managers on New Year’s Eve.
Daily report on shortage of TOP goods is actively used as it alerts to the out-of-stock risk beforehand and enables to make an unplanned order to supplier.
With the help of NON-Movers report (goods that are generating less than 2% of business profits), you can decide whether to remove a product from the assortment.
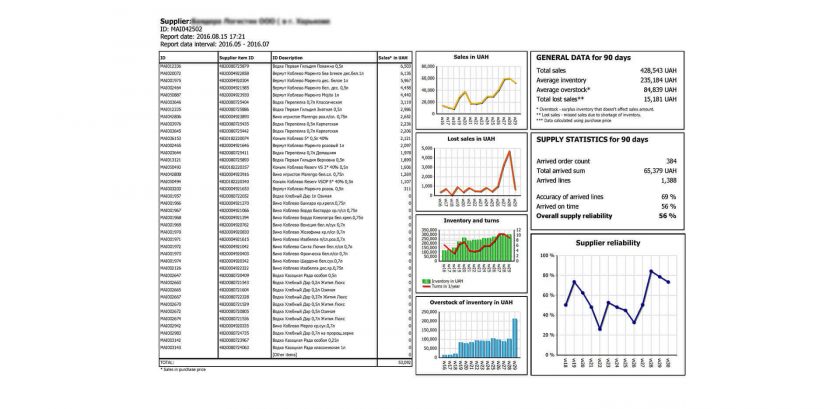
Data from the report on supplier’s credibility are used during negotiations; the report contains the supplier’s discipline regarding the performance of contractual obligations.
Economic order quantity, reducing the level of lost sales and other results of the project
During the period from January to November of 2016, the following results were achieved:
- Orders became automated; the ordering process, as well as the process of inventory management became transparent. The economic order lot of the stock is defined automatically.
- As to the main indicators of inventory management: 1. Turnover accelerated by 1.5 times. 2. Loss of sales fall by 39%. 3. Surplus fall by 21%.
- Assortment of the stores was optimized. Slow-moving products were detected and removed from the assortment and it was reduced by 6%. As a result, the turnover ratio improved, the obsolete inventory level reduced, and the blocked money was free.
- The model of economic order for promotional products was optimized.
We are grateful to the project’s teams for their professionalism and effective work on achieving the stated objectives. Special gratitude to the company’s TOP management for active position in the matters of implementation, as well as for constant searching of possibilities to improve the current rates of inventory management.
We would like to invite you to find out about the inventory management system ABM Inventory at our open webinars.


