Inventory Turnover: Calculation, Formulas, and Performance Analysis
What is Inventory Turnover
Definition and Economic Meaning
Inventory turnover is a metric that shows how many times during a certain period (month, quarter, year) a company completely renews its stock of goods or materials. In other words, it demonstrates the speed at which funds invested in inventory are converted back into cash through sales.
The economic meaning is straightforward: the higher the turnover, the more efficiently a company uses the capital tied up in its inventory. Low turnover indicates “frozen” funds, high storage costs, and the risk of obsolete stock, while high turnover reflects more rational inventory management and lower expenses.
For businesses, this is critical: the indicator is directly linked to liquidity, profitability, and competitiveness. In retail, where margins are relatively low, increasing inventory turnover often brings more benefits than raising prices or boosting sales volume.
What Does Inventory Turnover Show in a Company
Inventory turnover indicates how effectively a company manages its resources and how quickly they are converted into sales. This metric reflects:
- Speed of goods movement — how quickly products move from the warehouse to the customer.
- Rationality of purchasing — whether there are excessive stocks in storage or, on the contrary, shortages leading to lost sales.
- Utilization of working capital — how much money is “frozen” in inventory and whether it can be released for other purposes.
- Management efficiency — the effectiveness of assortment planning, demand forecasting, and supplier relations.
Thus, in retail, the turnover ratio serves as a key performance indicator: the faster inventory is renewed, the lower the storage costs and the higher the profitability. Conversely, a decline in turnover signals stock accumulation, falling demand, or procurement errors.
Difference Between Inventory Turnover and the Turnover Ratio
In practice, these terms are often used as synonyms, but there is an important distinction.
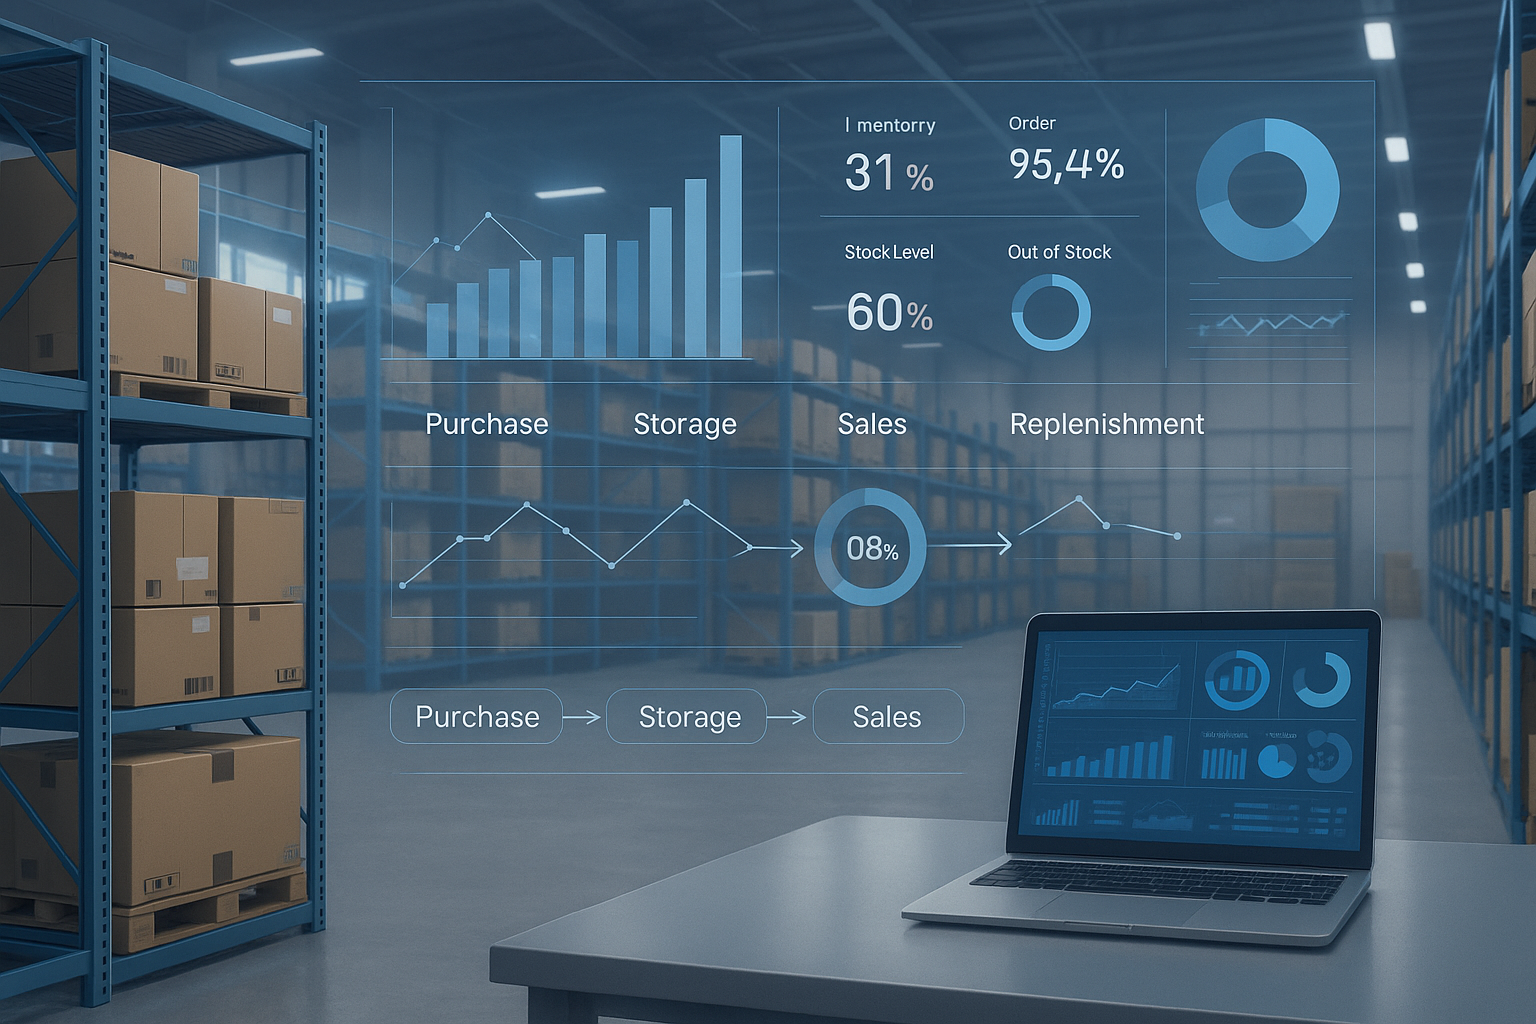
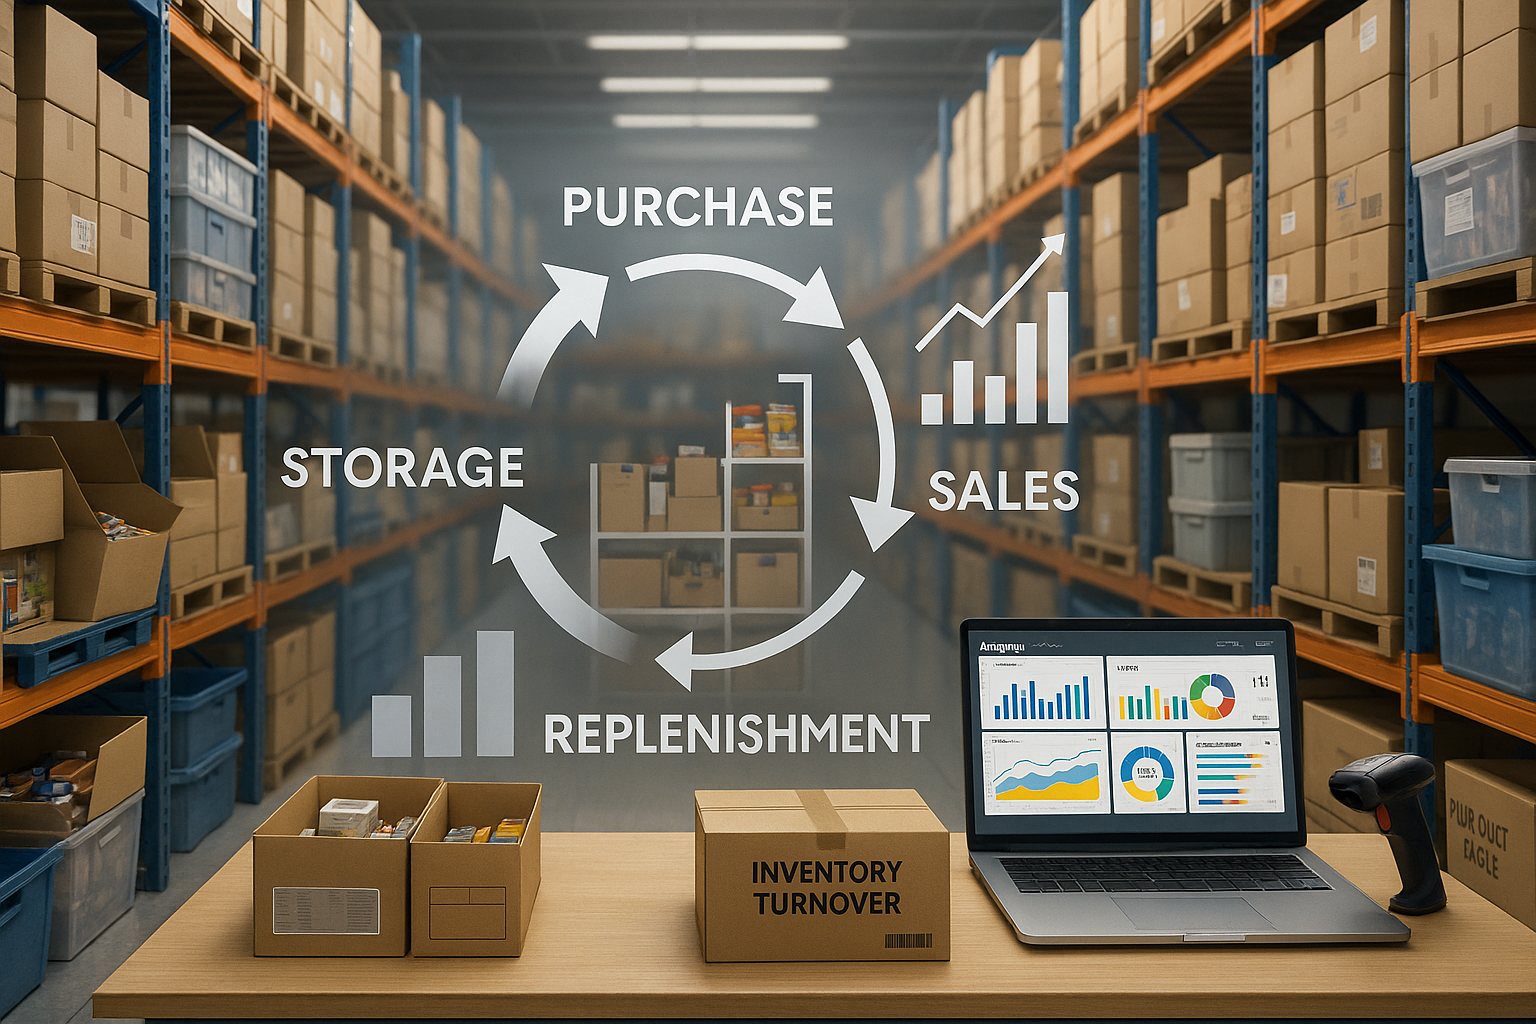
- Inventory turnover is a broader concept describing the process of stock renewal — how many times during a certain period goods go through the cycle of “purchasing → storage → sales.”
- Inventory turnover ratio is a specific numerical indicator that measures the speed of this process. It is calculated as the ratio of sales volume (or cost of goods sold) to the average inventory value for the selected period.
Simply put: inventory turnover is the phenomenon, while the turnover ratio is the tool for quantifying it.
Inventory Turnover Metrics
Inventory turnover can be measured in different ways, depending on the purpose of the analysis. In practice, several key metrics are used to assess how effectively a company manages its inventory.
Inventory Turnover Ratio
The inventory turnover ratio shows how many times during a chosen period a company has completely sold and replenished its average stock. The higher the ratio, the faster goods are sold, and the less capital is tied up in inventory.
Inventory Turnover Period in Days
The turnover period is measured in days and shows how long, on average, it takes for inventory to be converted into sales. The formula is the inverse of the ratio: the higher the turnover ratio, the shorter the period.
Norms and Optimal Values
There is no single universal benchmark — the optimal turnover depends on the industry, product assortment, and company operations.
- In FMCG retail, high turnover is the norm — inventory may be renewed every 10–30 days.
- In DIY and non-food segments, the cycle is longer, sometimes 60–120 days.
- In manufacturing companies, turnover of material inventories is often lower due to large volumes of finished goods and raw materials.
The main rule: metrics must align with the company’s strategy. Very low turnover signals overstocking and increased costs, while excessively high turnover creates the risk of shortages and lost sales.
Formulas and Calculation of Inventory Turnover
To use this metric effectively in management, it must be calculated correctly. Depending on the available data, different formulas can be applied.
Inventory Turnover by Balance Sheet
One method is based on accounting data. It compares the average inventory value for the period with the cost of goods sold (COGS):
- Turnover Ratio = Cost of Goods Sold / Average Inventory
This approach helps financial managers understand how efficiently the company uses its material resources.
Calculation by Revenue and COGS
УIn retail practice, turnover is often calculated using revenue:
- Turnover Ratio = Revenue / Average Inventory
However, the method based on COGS is considered more accurate, as it eliminates the impact of markups and discounts. The choice of formula depends on the analysis objectives.
Inventory Turnover in Turns
Inventory turnover in turns shows how many times per year (or other period) a company completely sells through its average stock:
- Turnover = Cost of Goods Sold / Average Inventory
The higher the value, the faster inventory cycles and the less capital is locked up in stock.
Example of Inventory Turnover Ratio Calculation
Suppose the company’s average inventory value during the year was $200,000, and the cost of goods sold was $1,000,000:
- Turnover Ratio = 1,000,000 / 200,000 = 5
This means the company renewed its inventory 5 times during the year.
Inventory Turnover in Days
For easier interpretation, the turnover ratio is converted into days: Turnover Period = 365 / Turnover Ratio
In our example: 365 / 5 = 73 days
On average, goods remain in stock for about 73 days before being sold.
Analysis of Inventory Turnover
By itself, the turnover ratio is just a number. Without proper analysis, it provides little insight. To understand how effectively a company manages its stock, the results must be evaluated in dynamics and in the context of the industry.
How to Interpret the Results
High turnover means the company sells goods quickly, reduces storage costs, and uses working capital more efficiently.
Low turnover indicates excessive inventory, purchasing mistakes, or declining demand.
It’s important to remember: excessively high turnover also carries risks — such as frequent stockouts and lost sales opportunities.
Dynamics and Changes in the Ratio
Comparing turnover over different periods helps identify trends. Growth in turnover may signal improvements in purchasing and sales management. A decline often points to accumulating obsolete stock or weakening demand.
Factors Affecting Inventory Turnover
Product assortment and seasonality — fast-moving categories (FMCG, fresh) turn over more often than non-food or DIY.
Supplier terms — lead times, minimum order quantities, and flexibility of deliveries.
Warehouse logistics — efficiency of storage, movement, and order picking.
Accuracy of demand forecasting — helps prevent both overstocking and shortages.
Level of automation — inventory management systems allow real-time control and order adjustment.
Marketing and promotions — discounts and campaigns speed up sales, but if poorly planned, they can cause returns and excess stock.
Signs of Low or High Turnover
Low turnover: stockpiles of finished goods, rising storage costs, products becoming outdated or losing quality.
High turnover: goods barely stay in the warehouse, but there is a high risk of stockouts and lost sales.
How to Improve Inventory Turnover
If analysis shows that turnover is slowing down, companies should take action to accelerate the flow of goods. Practical tools include:
Inventory Optimization
Regular stocktaking, reviewing storage norms, and using ABC/XYZ analysis help reduce “ballast” items and focus on the most important product groups. Learn more in the article on inventory management optimization.
Supply and Procurement Management
Flexible supplier terms and proper application of the economic order quantity formula help reduce overstocking and shorten replenishment cycles.
Demand Forecasting
Modern ML models account for seasonality, promotions, and sales dynamics, making forecasts more accurate. This helps maintain balance between excess inventory and stockouts.
Reducing Obsolete Stock
Working with slow-moving and obsolete items is essential for improving turnover: clearance sales, marketing campaigns, and redistribution between warehouses and stores. A well-planned promotion strategy speeds up the sell-off of “heavy” products and frees up working capital.
Automating Inventory Management with ABM Inventory
Managing turnover manually is nearly impossible: too much data, too many factors, and costly errors. That’s why more and more companies adopt inventory management software to automate key processes.
ABM Inventory helps retailers and distributors comprehensively control their stock, accelerate inventory turnover, and reduce costs.
Key system capabilities:
- Dashboard: daily tasks, dynamics of overstocks and lost sales.
- Demand forecasting: ML algorithms consider only significant factors (seasonality, promotions, trends).
- Auto-replenishment: the system calculates the need for each SKU daily and generates purchase orders automatically.
- Fresh categories: accounts for shelf life and weekly demand variations.
- Promotion management: forecasting demand for promotional items, adjusting orders during the campaign, and evaluating effectiveness afterward.
- BI analytics: more than 40 reports covering turnover, overstocks, availability, and promotion results.
- Multi-level optimization: balancing inventory across warehouses and stores, considering various supply chain models.
Business results of ABM Inventory implementation:
- reduction of excess stock;
- fewer write-offs;
- accelerated inventory turnover;
- freed-up working capital and increased profitability.
Learn more about the inventory management software.
FAQ
What is a normal inventory turnover ratio?
There is no universal benchmark — the ratio depends on the industry, assortment, and business model. In FMCG, it may range from 10–30 times per year, in non-food segments — 4–8, while in manufacturing companies it is often lower. It is essential to track dynamics and compare against industry norms.
What factors affect inventory turnover?
Turnover is influenced by assortment structure, seasonality, supplier terms, marketing and promotions, and the level of automation. For example, automated replenishment systems help maintain balance and avoid overstocks.
What does inventory turnover mean?
Inventory turnover is a metric that reflects how many times within a given period a company’s stock is fully converted into sales. It shows the efficiency of resource use and the speed of capital recovery.
What does the inventory turnover ratio show?
The ratio shows how quickly a company’s stock is renewed and how much capital is tied up in inventory. A high ratio signals effective management, while a low one points to overstocking and lower liquidity.
What does inventory turnover show?
It demonstrates the speed of product movement and the efficiency of inventory management. High turnover means faster sales and lower storage costs, while low turnover indicates stock accumulation and lost profit opportunities.