Effects of Power BI implementation
Full transparency
Allows owners and shareholders to see the real situation of the business
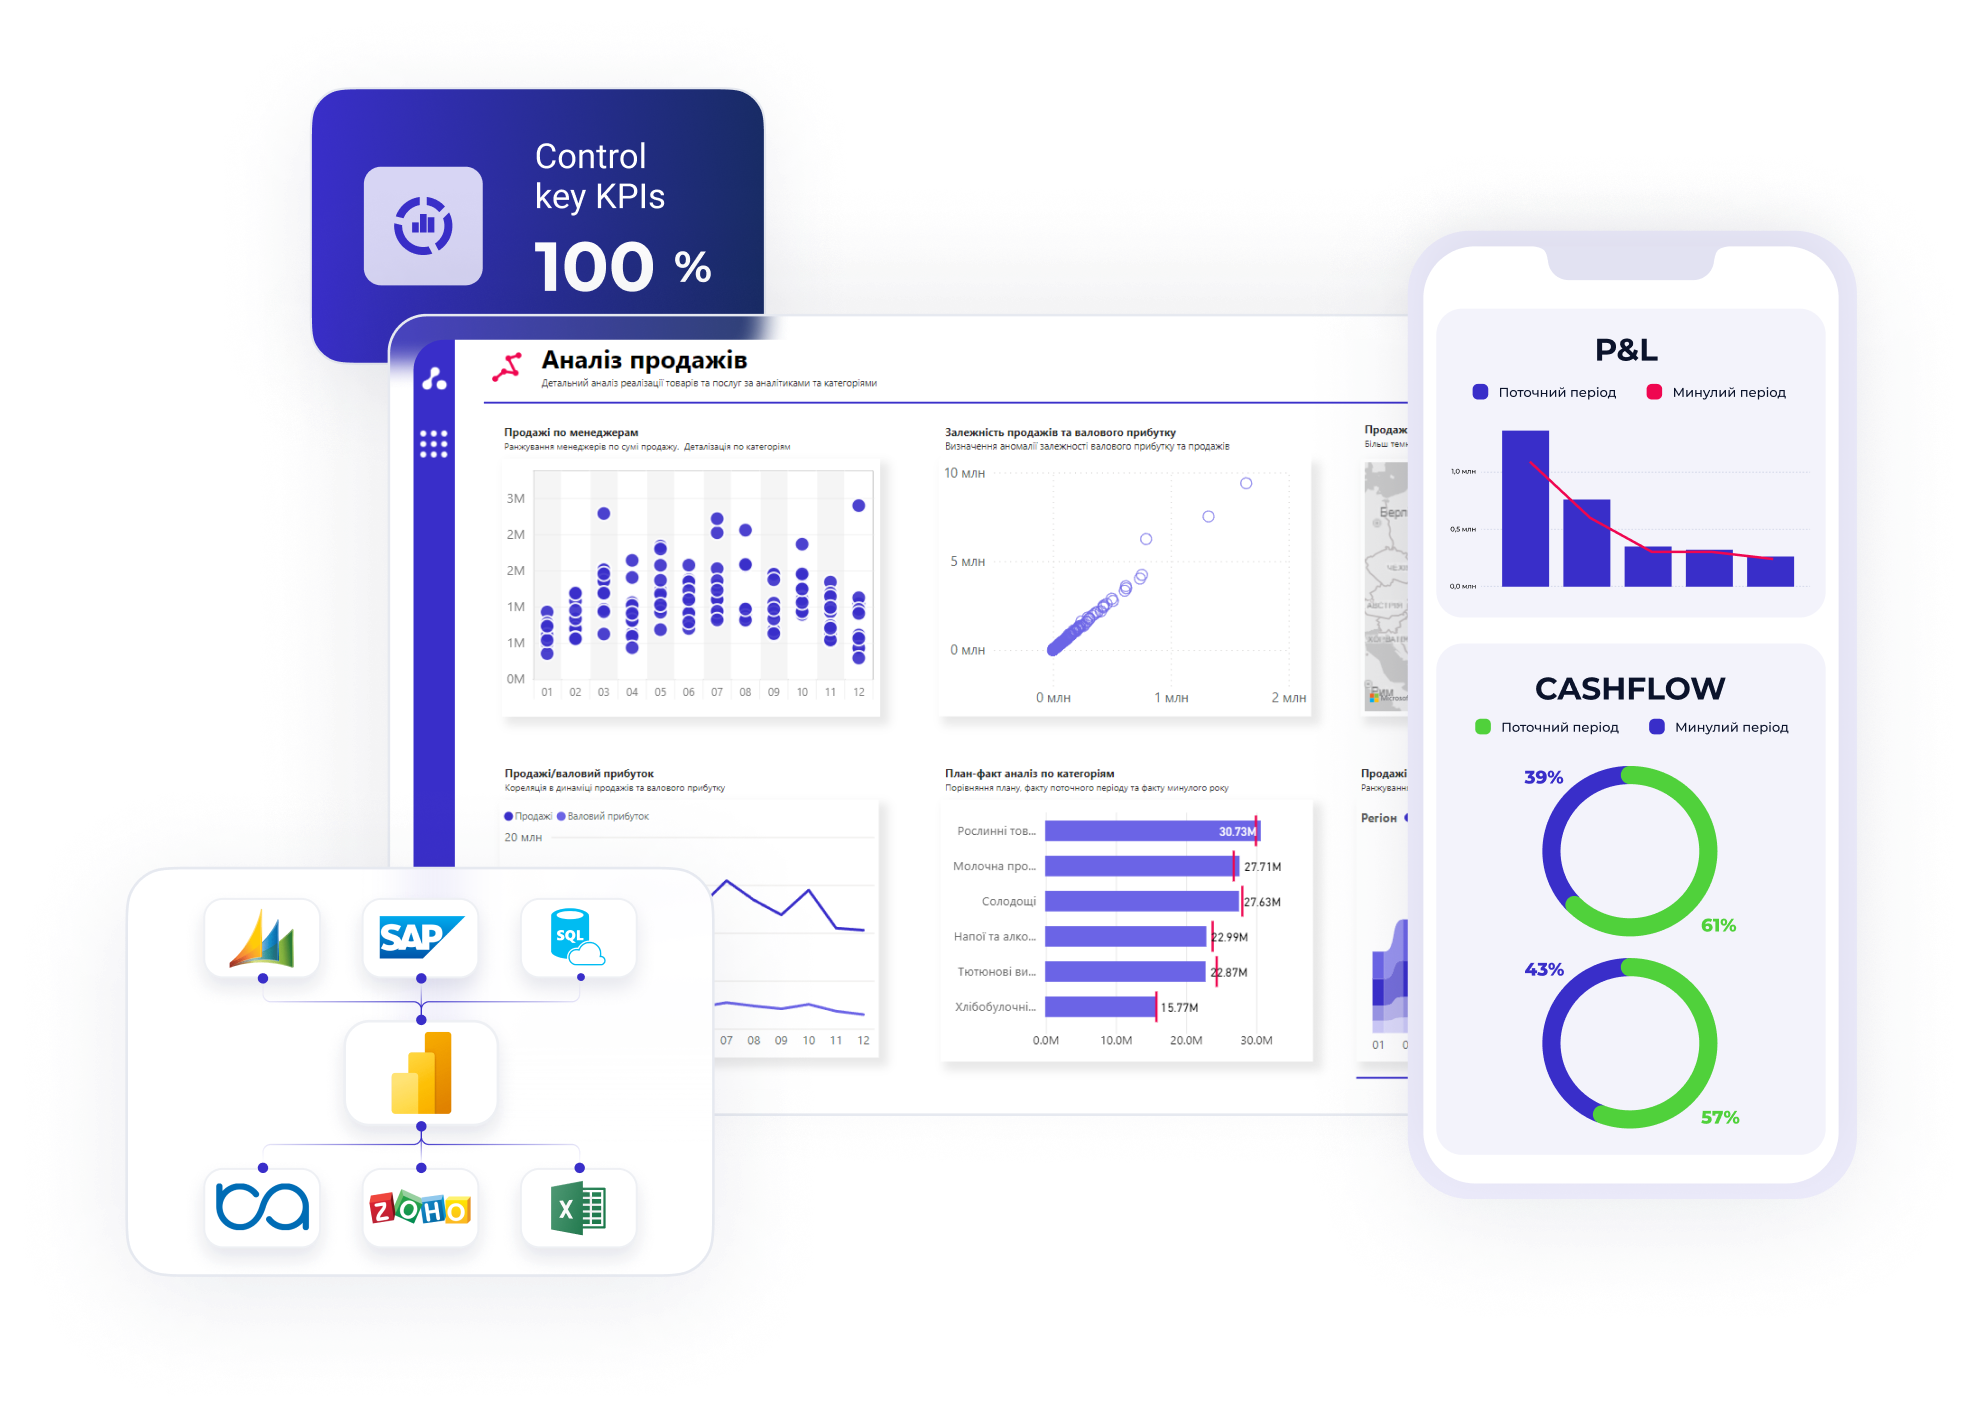
Control
Full control of key KPIs
Operational reporting
Receive reports 10 times faster. Saves time for management and employees
Analytics
Understand complex analytics in simple dashboards, graphs, and charts. Comprehensive analysis of trends, correlations, and data structures
Ease of use
24/7 access to data online from various gadgets
Business development
Increase business value and improve capital turnover
Helping companies manage business performance
-
 Agribusiness
 -
Development and construction
-
Pharmaceuticals
-
Food & Beverages
-
Media
-
Transport and logistics


With Power BI you will get

-
Combining data from different sources
Power BI allows you to combine data from different sources such as databases, spreadsheets, CRM and others. This creates a single, consolidated view of all business processes.
-
Data retrieval speed
BI technologies make it possible to increase the speed of data retrieval tenfold. There is no need to search for the necessary information on different systems, all the main KPIs will be available in one click.

-
Clear reporting and data visualisation
The system provides convenient data visualisation tools such as: charts, graphs, interactive panels and other graphical elements. This allows users to quickly understand complex information and make the right management decisions.
-
Easier perception of patterns and trends
Through the use of predictive algorithms and machine learning, BI helps identify trends in data, understand market demand and identify business opportunities. This allows a company to be more competitive and adaptive to various market events.

-
Automation of sales reports
Manager's dashboard, primary and secondary sales, ABC + XYZ analysis, factor analysis of sales, etc.
-
Actual logistics reports
Inventory structure and turnover, purchasing and back margin analysis, transport logistics analysis, product cost indices.
-
Setting up reports for retail for retail
Retail chain analysis, map analysis, loyalty programme analysis, outlet opening hours and loading, cheque analysis.
-
Automation of production reports
Plan-to-fact, defect report, cost of production, unit rates and others.
-
Marketing reports
RFM analysis, customer base analytics, end-to-end traffic analytics, CRM analytics, effectiveness of marketing campaigns, etc.
-
Implementation of personnel reports
Individual Entrepreneur structure, motivation and modelling system, recruitment funnel, analysis of reasons for dismissal, implementation of KPIs of departments and employees.
 (1)")
-
Business on the phone
With a cloud-based solution, any trusted user from any gadget can get the information they need online 24/7.
-
Safety
Differentiation of user access rights at the level of elements of directories and classifiers. This means that the user will have access only to the information (analytics) to which he/she has access rights.


")


")


")


How Power BI is being implemented
01 Rapid diagnosis
02 Methodology
03 Customising dashboards
04 Corporate support
Estimating the scope of work
Valuation (Fixed price)
Prototype
Model development
Customising the layout
Connecting to data sources
Setting up a model in Power BI
Project launch
Support
Refinements
Benefits of working with Power BI

Reducing the human factor
Automated consolidation, synchronisation and transformation of data from any system

Quick response time
"Live" charts and graphs on key indicators and mobile access to them 24/7

Accurate control of KPIs
Setting up indicators on the desktops of the company's top managers: desired, critical and target values
Frequently asked questions
How does business intelligence work?
The system consolidates, synchronises and transforms data from any system. The user sees tabular reports and interactive dashboards based on them. It is possible to set up individual benchmarks on the desktops of the company’s top managers. The system will notify the manager when the main KPIs are reached.
How long does it take to implement the system and what resources should the company allocate?
It all depends on the scope of work, the number of dashboards, and the number of databases – on average, 3-5 months.
The customer company must have an analyst who is familiar with financial processes and a technical specialist for integration.
Is it possible to integrate BI analytics into an existing accounting system?
Absolutely! The system integrates seamlessly into any system.
What sources can I get information from?
Any digital data: Excel, databases, crm, website data, open data from the Internet, csv files, etc. If we can’t connect directly, we’ll create a cloud solution that would retrieve information from the necessary systems, and then connect to this data from Power BI.
We appreciate you contacting us. One of our specialists will get back in touch with you soon. Have a great day!